Contact us
Get in touch with our experts to find out the possibilities daily truth data holds for your organization.
.jpg?width=64&name=Mike-Wollersheim-1%20(1).jpg)

The technique of Interferometric SAR (InSAR) can seem overwhelming and is often associated with complicated equations and rainbow-colored interferograms that can raise a barrier preventing some users from realizing the rich content of this data.
A whole blog series - and indeed many books - can be dedicated to the concept of InSAR, but you won’t need an advanced degree in physics to find value in this data (but if you have one, that’s great!). Even traditionally complex scenarios, like long-time series deformation monitoring, are available as easily-consumable graphics and reports using modern tooling and workflows. That means there is no need to necessarily understand the finer points of how the interferometry process works.
This is the last blog in our series exploring the unique insights that are made possible through ICEYE’s Daily Coherent Ground Track Repeat (GTR). The first blog discussed the principles of GTR and how it allows tracking change patterns over time. In the second blog we discussed the incredible power that is unlocked when exploiting the concept of phase in SAR imagery, enabling us to detect changes that are a fraction of a wavelength in size (< 3 cm for X-Band radar).
In this blog, we explore a different way to unlock the value of phase information provided by SAR imagery. We go beyond detecting the small, often invisible, changes and show how you can measure the change in phase to learn about the shape of the landscape and even examine the stability of the objects you observe.
We would be remiss if we didn’t at least give a cursory overview of what’s happening behind the scenes. At its core, InSAR is a technique that leverages the phase difference between two or more SAR observations that are taken from nearly the same location. It allows measuring the terrain height or to detect and measure small changes in the Earth at the millimeter and centimeter scale - just as with coherent change detection, which was discussed in the previous blog.
Like coherent change detection, InSAR is also completely enabled by the ability to control the satellite orbits so that images are taken with nearly identical geometry from one day to the next. Coherence is a measure of the similarity between SAR observations at the very precise, sub-wavelength level. The phase measured for any pixel can be a combination of contributions from many elementary scatterers like rocks, leaves, blades of grass and stalks, or pieces of dirt.
In coherence change detection, we were looking for areas where the phase contributions changed so significantly that it caused a noticeable loss of coherence.
Figure 1. Example of coherence change caused by vehicle traffic through fields between January 21/22 and January 22/23, 2022.
The situation is a bit different for InSAR measurement. For InSAR to succeed, the signal must remain highly coherent between successive observations. If the SAR signal changes “too much”, we lose coherence and our ability to measure the phase becomes far less reliable.
So how much change is too much change? Thinking again of the concept of a pixel with many elementary scatterers, each contributing to the phase. The relative position and orientation of each object determines what this area will “look” like to the SAR sensor. Disrupting this fine balance of signal contributions will cause you to lose coherence. Imagine that the same collection of objects are moved identically by some amount. This will change the phase, but the objects still “look” similar to the SAR. On the other hand, if you cut some grass, move some dirt and add some rocks, this pixel will now have a completely different combination of phases and will “look” different to the radar.
By that definition, pixels that “look” the same to the radar in successive images will be coherent and can be analyzed using InSAR, even if those objects subsided or heaved a bit between measurements. A common problematic target for X-band InSAR is leafy vegetation, since even the slightest wind causes a completely different phase combination for the image pixels (even if they look the same to your eye), which usually means a noticeable loss of coherence.
When you do succeed in collecting a coherent pair (or even better, a deep stack!) of InSAR images, the phase differences are composed of several pieces, each of which can give us different insights about the environment:
We can choose to focus in on the different aspects of that phase, depending on what we are interested in observing. By focusing on the topographic phase we can examine the landscape and build elevation maps to capture the often stunning terrain of our world. Some of the most ubiquitous elevation models in use over the past 20 years have been generated using InSAR, including the SRTM and Copernicus global DEMs.
If we already know the terrain (thanks perhaps to one of the aforementioned global DEMs), we can remove the topographic component and examine the deformation phase for land subsidence monitoring. Of course we won’t ignore the atmosphere and noise contributions. Each can be managed and mitigated so that our topographic and deformation models are as accurate as possible.
Digital Elevations Models (or DEMs) can be created by examining the topographic phase component. In these cases, we want to take a snapshot of the terrain at a particular point in time. The best results are obtained when the images are collected as close as possible to the same time (or even simultaneously). As time passes, there is more and more opportunity for things to change, which will lead to low coherence and gaps in our elevation model. Most applications have a low tolerance for missing data, so it’s critical to generate as complete a dataset as possible.
Daily revisit with ground track repeat (GTR) helps to significantly reduce the effect of this temporal decorrelation and also allows us to provide more frequent updates to terrain models. It’s commonly thought that the Earth changes slowly, but we’ve seen over and over how large events can cause sudden and dramatic changes to the landscape. The world is a dynamic place and as soon as a DEM has been generated, it’s already starting to go stale.
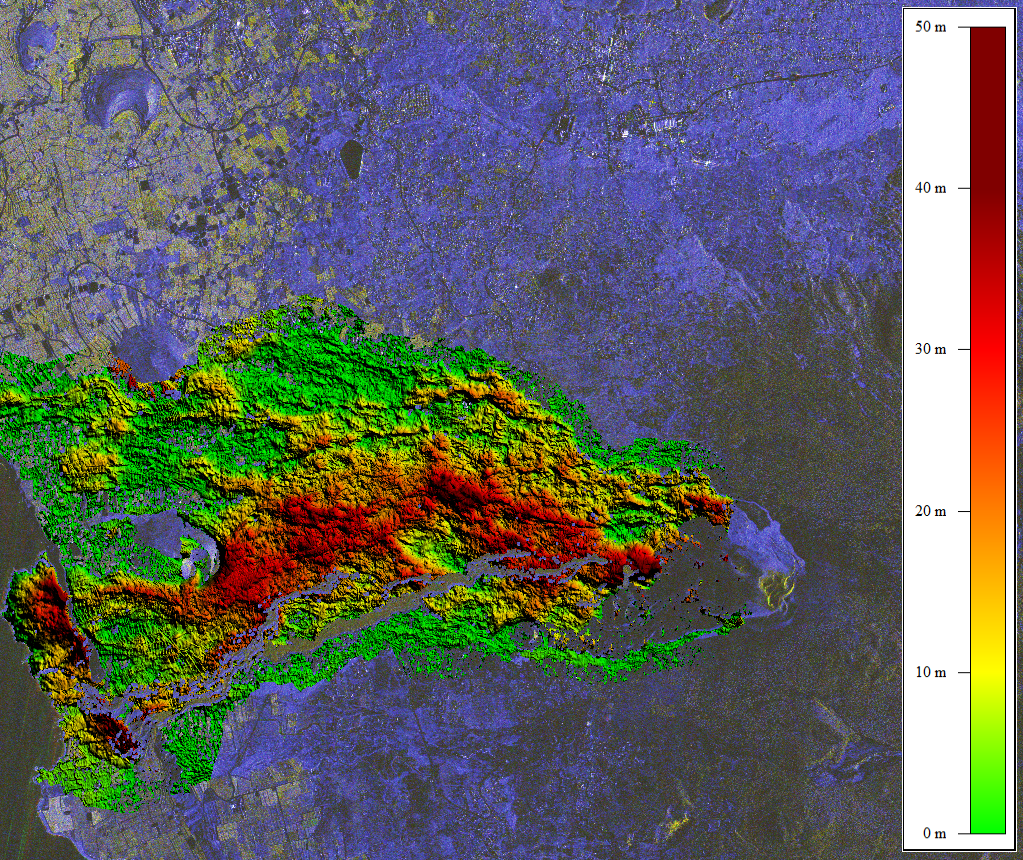
Figure 2. Changes in elevation of up to 50 m caused by hardened lava deposits from the eruption of the Cumbre Vieja Volcano, La Palma, measured by ICEYE InSAR in December 2021.
While the Earth’s surface can often experience sudden dramatic changes, there are also many places that change quite slowly, millimeters at a time. The land can heave or subside depending on any number of factors, including permafrost thaw, groundwater depletion, mining activity and many more. These changes can cause critical issues for infrastructure built across an area that also happens to be deforming. These surface movements and deformations can cause cracks in paved roads, but in the worst case they can also trigger the collapse of bridges, dams and buildings.
For InSAR applications of land subsidence, it’s most important to continue imaging the same area from almost the same position over an extended period of time. With ICEYE’s daily GTR capability, we can quickly generate a large number of observations to track slow and even fast-moving deformation patterns.
By watching these patterns over time, you can adjust how frequently you need to watch depending on new information that emerges. For example, monthly monitoring of pipelines may be perfectly adequate until you notice a deformation starting to accelerate. Perhaps then it’s time to queue up the weekly or even daily monitoring so you can identify critical failures before they happen.
Figure 3. Deformation pattern of the Fagradalsfjall Volcano in Iceland immediately before and after an eruption. Each fringe represents a deformation of ½ of a wavelength (~1.5 cm). Daily imagery allows observation of the very rapidly changing deformation signals.
The exciting thing about building a deeper and deeper stack of coherent images is that we can quickly amass enough information to enable another class of InSAR, called Persistent Scatterer Interferometry (PSI). Here we look at the phase properties of individual bright scatterers in the scene to very reliably determine the deformation time series, meaning how much each object moves over time.
For this method to be viable, you must first collect a sufficient number of images, typically at least 25 to 30 but preferably much more. The amount of time needed to gather those images can be quite extensive if your ground track repeat period is several days. This is just one more reason that Daily Coherent GTR can speed up the process and get you insights sooner.
This method of InSAR is very precise and provides a 3D “cloud” of points. Just when you thought SAR meant “cloud-free”. As an example, you can generate PSI points vertically along a building's facade to examine how the deformation changes at different levels of the building due to seasonal thermal expansion.
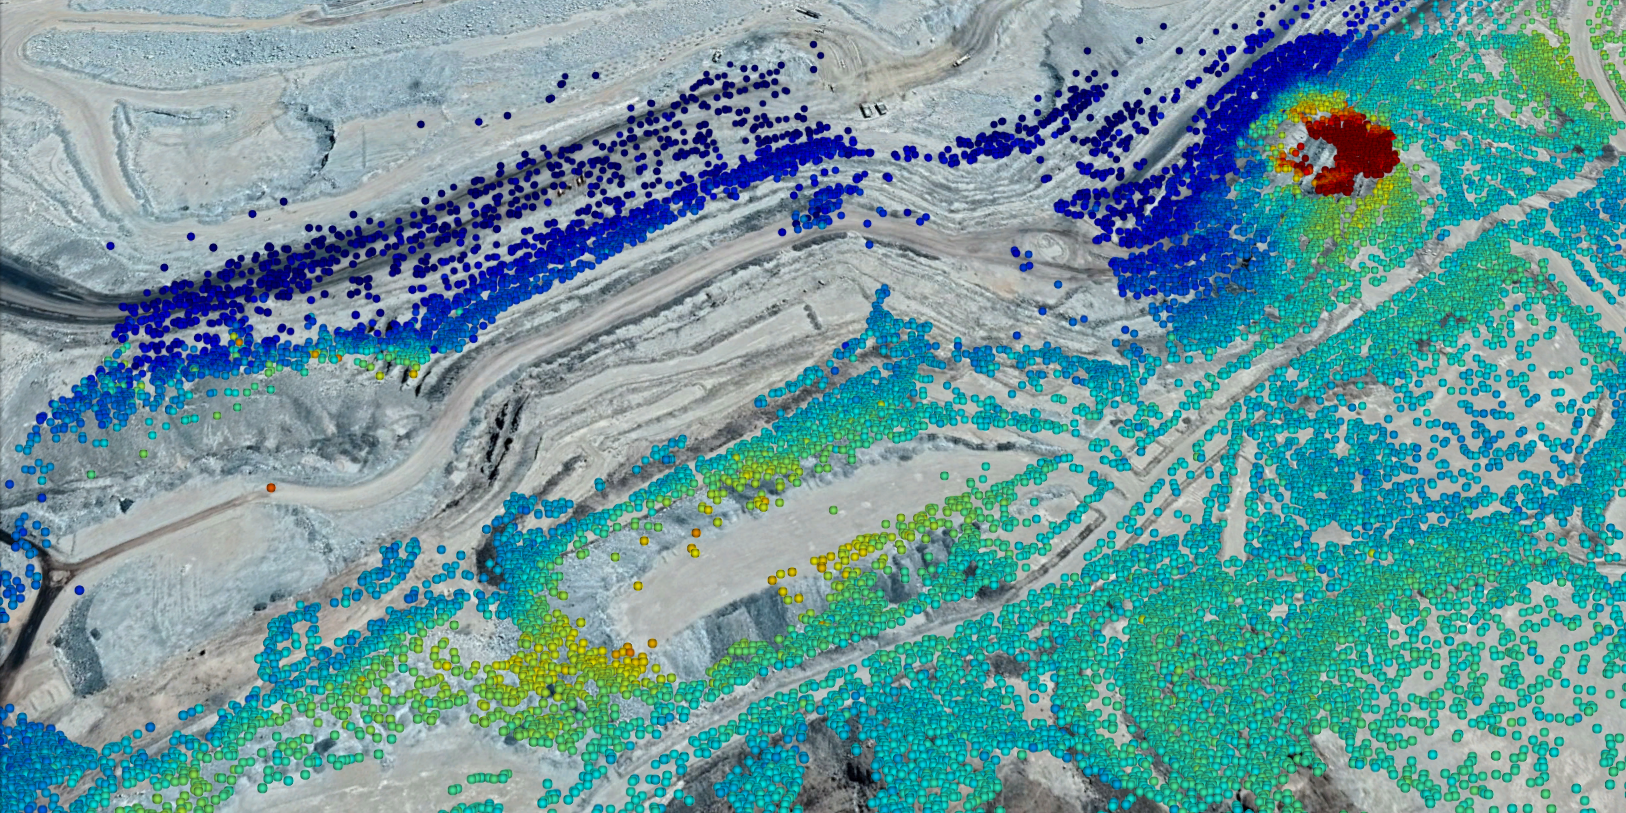
Figure 4. PSI deformation map showing points colorized by deformation rate at Rossing Uranium Mine in Namibia. One location (red) shows significant and continuous deformation on the steeply sloped edge of the mine.
ICEYE has been utilizing SARPRoZ software to generate impressive PSI datasets for many applications, including infrastructure monitoring and precise 3D height reconstruction for built environments.
In addition to deformation rates, you can also produce a residual topographic layer, indicating the height of objects in a scene above your reference terrain. This can be used to generate detailed height models as 3D point clouds.
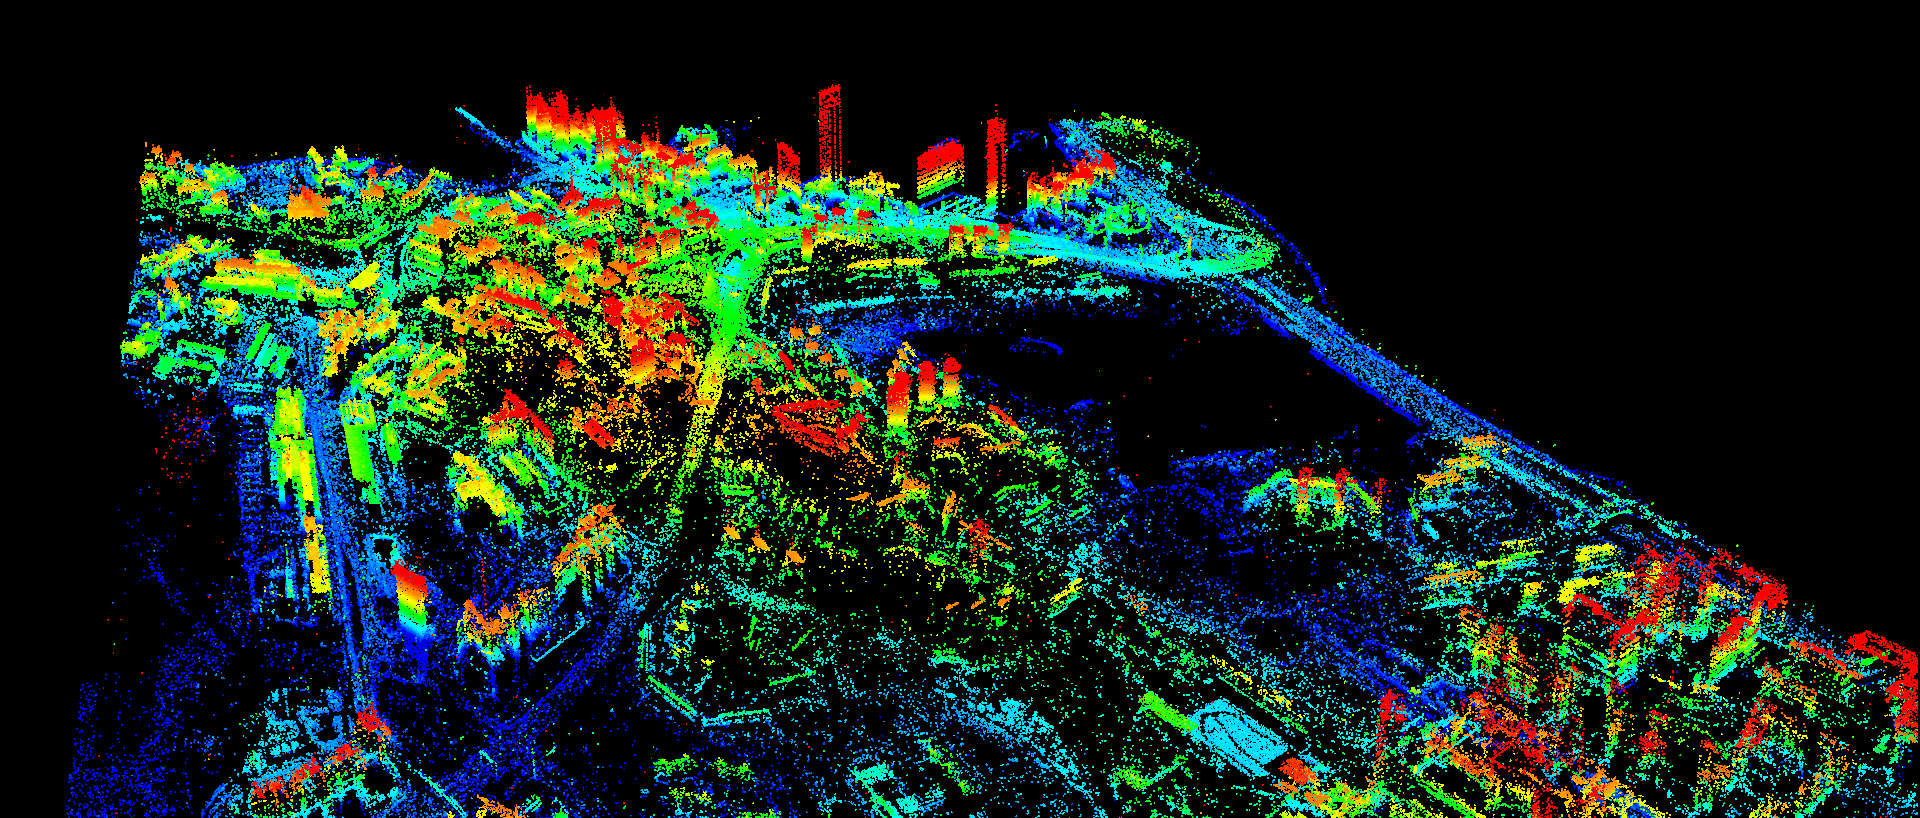
Figure 5. PSI residual topographic map near ICEYE’s Espoo office in Finland, showing a 3D elevation point cloud colorized by height above ground. Building level detail is clearly visible in this scene.
We hope this blog has given you a clear overview of what’s possible with SAR interferometry and how powerful it is in observing areas and tracking subtle changes, either daily or over time, when the right imagery is available.
ICEYE has already demonstrated the power of the Daily Coherent Ground Track Repeat data stacks in several examples for persistent monitoring, such as daily analysis of global oil supplies. And we are happy to share that GTR time-series with Spot or Strip imaging modes will be available to the commercial market soon.
Until then, discover the value of this unique monitoring technique and download three coherent, very high-resolution Spot images acquired on consecutive days:
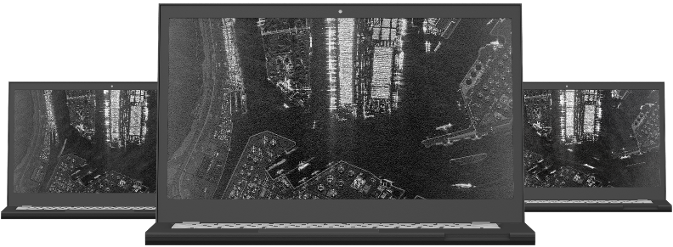
Download 


03 June 2026

23 January 2026

06 November 2025