Contact us
Get in touch with our experts to find out the possibilities daily truth data holds for your organization.

The daily observing and tracking of the smallest changes over time opens a new view into the processes and activities that are happening on our planet. Synthetic-aperture radar (SAR) technology has the unique capability of visualizing even changes that are smaller than the size of a pixel.
ICEYE’s SAR satellite constellation enables persistent monitoring and very accurate change detection analysis by taking daily images with precisely the same imaging geometry from space. This was addressed in our last technical blog.
The goal of this blog is to dig deeper into a type of change detection called ‘Coherent Change Detection’ (CCD) and to explain how ICEYE’s one-day repeating ground tracks offer a novel capability in the field of earth observation.
First, we need to do a bit of preparation work to make sure we are all at the same level of understanding. Let’s get started.
As we know, radar pulses are made from electromagnetic radiation. Each ICEYE radar pulse is centered at 9.6 GHz.
The satellite antenna transmits a pulse for a short period of time and measures the amount of time it takes to reflect from an object and return back to the radar sensor. Because we know the speed that the pulse travels – the ‘speed of light’ – and the time the journey took, we can calculate the range to the object that it was reflected from.
Objects further away take longer for the pulse to travel to it, reflect from it and arrive back at the receiver. Here, the rising and falling electromagnetic wave of the returning pulse is measured.
Figure 1 shows the example of the rise and fall of a wave that doesn't complete a whole number of wavelength cycles and finishes one third of the way through the last wavelength. We call this fraction of a wavelength, the phase, and we store the information as an additional number in the pixel of the image.
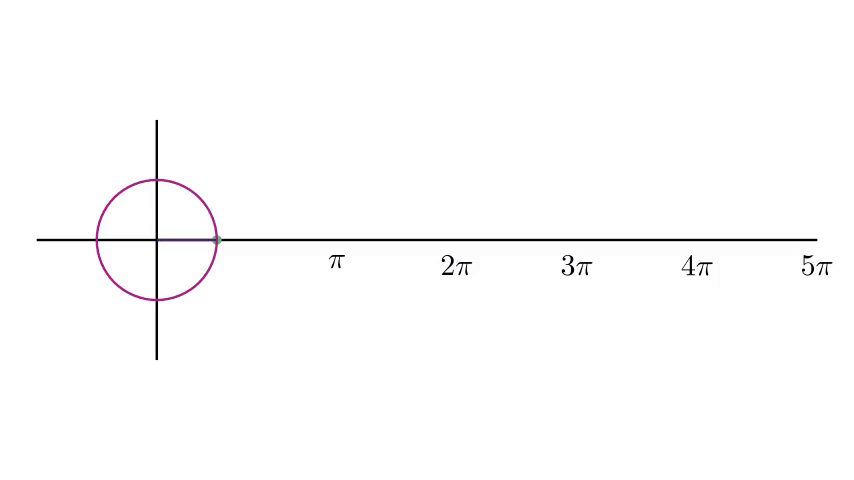
Figure 1. Phase of a transmitted electromagnetic wave
Because the phase repeats every wavelength, it's easy to think of it as an arrow rotating around in a circle with the length of the arrow representing the brightness or amplitude of the pixel and the angle between the arrow and the horizontal x-axis as the sample’s phase. We call this arrow a ‘phasor’, as it represents not just the amplitude of the measurement but also the phase (Figure 2).
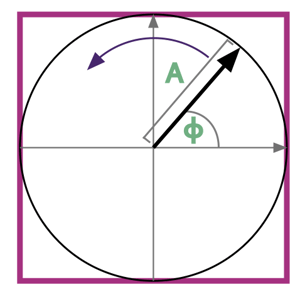
Figure 2. Each sample has an amplitude value A and a measure of the fraction of a wavelength φ (phase).
By convention, the term for a pixel or sample that contains both amplitude and phase information is called a ‘complex’ sample. Images that are made up of many complex samples are called ‘complex images’.
So now we have an intuitive understanding of how a SAR sensor measures the amplitude and phase of a single pixel. The total brightness of a pixel can be dominated by one or a small number of scatters, or it can be made up from many million individual scatterers, like blades of grass, rocks or pieces of dirt, all adding together.
Each pixel therefore has its own amplitude and phase, which are characterized by the complex scattering of the many miniscule objects within each pixel. We usually look at the amplitude of each pixel, as this forms an image of the radar reflectivity of the ground. This is what we usually think of as a SAR image. But it's equally valid to look at only the phase information in each pixel.
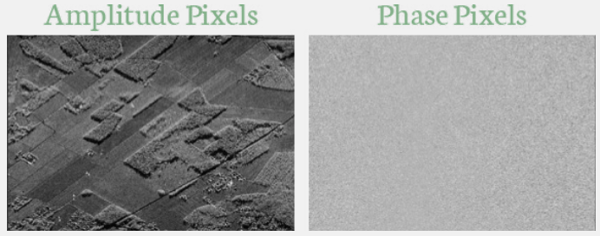
Figure 3. The two aspects of a complex SAR image. The more common view shows the amplitude of each pixel (left), but the phase of each pixel – ranging between 0 degrees (black) and 360 degrees (white) – can also be displayed (right).
If we were to take two complex images of the same location, we can carefully compare the phase inside each pixel and see how much the phase has changed. We call this comparison a measure of correlation and we can produce a change detection image from the comparison called ‘Coherent Change Detection’.
In these images, by convention, white means that the phase has not changed from one image to the next. Black (or shades of gray) means that the phase has changed to some degree, which, if the imaging geometry is the same, suggests that something inside that pixel is different today than it was yesterday.
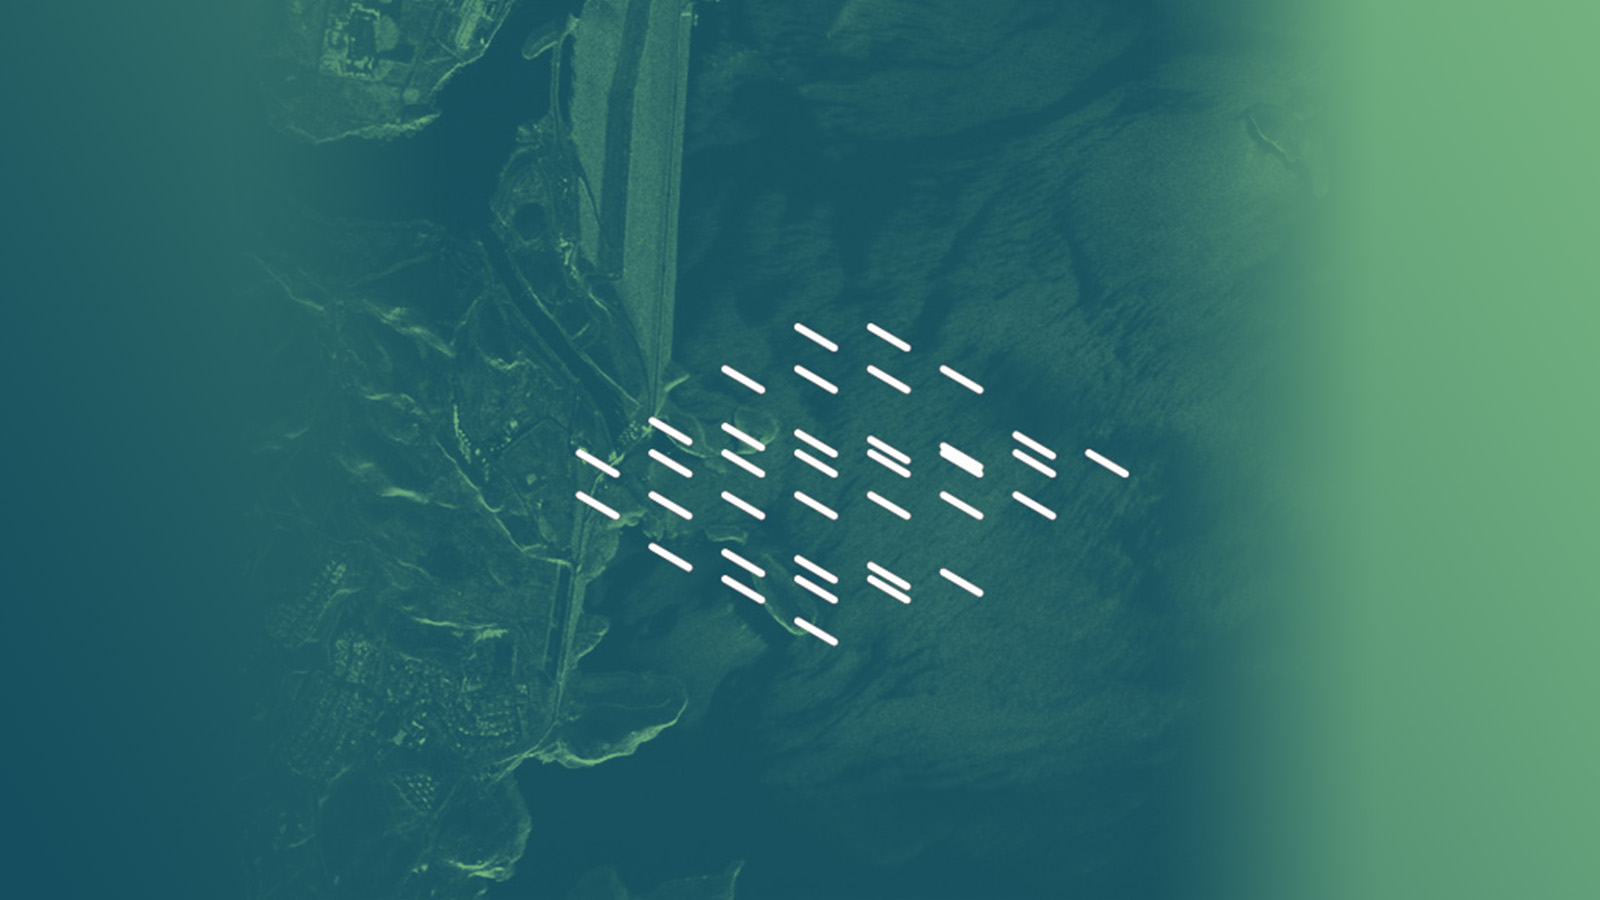
Figure 4 shows two coherence images over the Mosul Dam in Iraq created from three SAR images acquired on consecutive days. In this example, a person or vehicle moved equipment between the outer compound and the storage area along the wall between the first and second day (left image). Between the second and third day this same area was unused (right image).
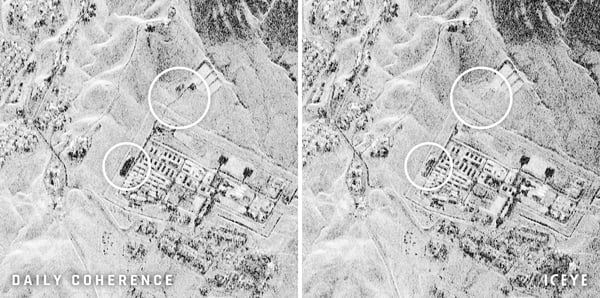
Figure 4. Change detection techniques applied to three images acquired over the Mosul Dam in Iraq.
The total amplitude and phase of a pixel is completely dependent on the direction from which the satellite is looking at the pixel. If the direction is different, the range to each of the smaller objects within the pixel would be slightly different. That would make it impossible to detect small changes happening on the Earth’s surface.
This is where the power of the Ground Track Repeat (GTR) comes in. Because each image is taken from precisely the same direction, all of the individual scattering elements within the pixel have exactly the same phase from one day to the next – as long as nothing has changed. These individual objects could be as small as blades of grass or rocks and pebbles.
But things do change. The world is constantly changing, whether it’s as a result of weather, human activity or plate tectonics. The key to understanding and better responding to these changes is the time over which we’re able to track them. Through experience we have discovered that images taken four or five days apart often have many natural weather-based changes.
But observing the ground every day, or eventually every few hours or minutes, reduces the chance of weather-driven change causing the phase of a pixel to vary.
So if changes caused by weather and environmental effects are reduced, what does this leave? Human activity and dynamic events. And these are exactly the sort of things that we care about.
Coherent Change Detection is incredibly sensitive but it's not without its drawbacks. One issue is that changes are dark or black, but so are shadows and areas of ‘SAR layover’. This is a real problem in traditional CCD analysis, as the analyst has to decide which changes are real and which are just unseen areas in the radar image. This is where the ‘power of the stack’ comes into play.
No SAR satellite provider has ever been able to provide daily repeating CCD imagery before. This means that CCD exploitation has always been applied to a single CCD image, leaving analysts with an exploitation headache and reducing the overall utility of satellite CCD products.
When we look at the same place, at precisely the same time every day and from the same direction (and with the same radar imaging mode and satellite configuration), we are able to remove a lot of the CCD uncertainty. Areas of shadow or layover are geometry-related, which means that the dark areas in the image always occur in the same location on every image – they are persistent in all images. But changes made by people on the ground are transient and occur intermittently throughout the stack (Figure 5).
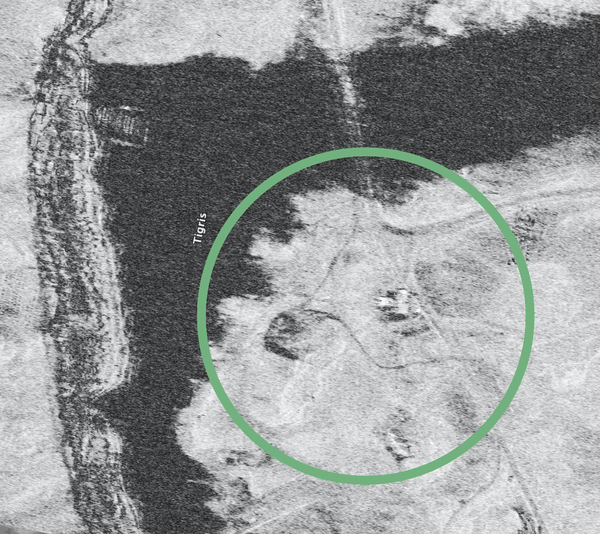
Figure 5. Excavation activity related to stemming at the Mosul Dam on 1st July 2021 is transient and shows up as a temporary change within the data stack.
This allows a kind of ‘change detection of Coherent Change Detection’ technique to be applied and provides a really useful ‘persistent monitoring’ capability that allows us to reliably identify even the smallest changes.
There is something really neat about this type of change detection. It's very different from the type of change detection used with optical systems or the type discussed in the first blog post. In those examples, changes were detected because something appeared different in one of the two original images. You could look at the image yourself and see the change.
But CCD is different. The level of changes we detect here are those that change the phase information within a pixel. Think about that for a second. The phase is a fraction of a wavelength. And our wavelength is 3 cm.
So if you have a satellite in a one-day repeating ground track that can isolate natural weather-based change, you can detect changes in the order of a fraction of 3 cm. From 800 km away in space. In any weather condition, day or night.
Now if that's not seeing the invisible, I don’t know what is.
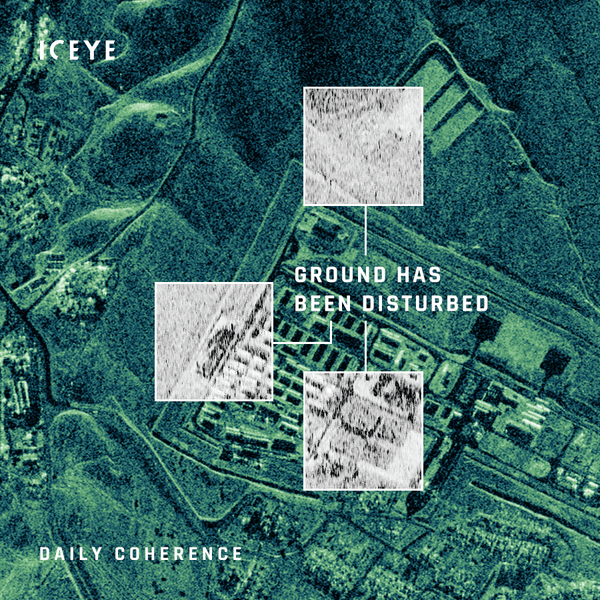
Figure 6. ‘Change detection of CCD’ technique applied to images over the Mosul Dam in Iraq.
In this post, we discussed the technology and value of daily coherent change detection for persistent monitoring enabled by ICEYE’s GTR data stacks. This capability can now be explored with a dataset consisting of three coherent Ground Track Repeat images acquired on consecutive days.
Download the world’s first Daily Coherent Ground Track Repeat dataset:
Download the 


03 June 2026

23 January 2026

06 November 2025