Contact us
Get in touch with our experts to find out the possibilities daily truth data holds for your organization.

Synthetic-aperture radar (SAR) satellites’ spectacular performance comes with an equally remarkable challenge of dealing with the inherent complexity of their data. This is an onerous characteristic that’s quick to overwhelm both novice and seasoned data scientists, many of whom do not claim to be SAR experts.
AI4SAR, a project sponsored by ESA Φ-lab, is an attempt to lower the entry barrier to SAR-based machine learning applications. As part of this initiative, the ICEYE Analytics team is examining and simplifying the specifics of the SAR data to support data scientists in iterating and implementing SAR-based ML use cases.
In this blog, Shay Strong, VP of Analytics, discusses what it means to leverage machine learning for SAR images and the team’s focus in the AI4SAR project.
NewSpace SAR satellites are alluring when you think about their total cost-to-quality ratio because they make high-frequency and high-fidelity Earth Observation (EO) affordable. But what makes the performance of ICEYE SAR satellites truly noteworthy is the gamut of Earth imaging parameters (for example, orbital geometry, viewing angle, and imaging mode) that these lightweight, X-band satellites gracefully support.
And they perform with steadfast agility, sensitivity, and finesse the task at hand, day or night. An ICEYE satellite can, for example, capture the same location every single day from different viewing angles and still provide a rich level of detail for a pretty accurate deforestation assessment.
That said, the sustained endurance does come with a conspicuously daunting task of handling the inherent complexity of the SAR data. It’s a challenge that Tapio Friberg, Irfan Ali, and Arnaud Dupeyrat, three SAR ML magicians at ICEYE Analytics, are intimately familiar with when they manipulate SAR data for their ML use cases.
While the amplitude product of SAR is convenient for ML computer vision (CV) applications, such as object detection, as it ‘feels’ like traditional visible imagery and is easily input to off-the-shelf ML workflows, it represents perhaps 25 percent of the entire SAR information content.
The complex physics of the backscattered SAR signal is entirely lost in such a shortcut. Maintaining the phase content of the signal quickly becomes overwhelming to casual and expert data scientists alike. But what is the value of the phase information? And as a consequence of the answer to the previous question: Is phase information really worth the trouble for SAR-based ML applications?
To that end, our team has been navigating many hypotheses. We certainly don’t have precise answers yet, but we have identified critical blockers to answering those questions. Downstream application development benefits from both: (1) the availability, accuracy, and persistence of SAR data AND (2) the resourcefulness/creativity of data scientists.
However, most data scientists are not SAR experts. So, being presented with such a steep learning curve quickly fizzles any shiny-object thrills one might have and precludes the exploration of an incredibly rich data source.
For now, we’ve decided to tackle this Everest of a challenge by focusing on making the data handling easier. This is where Tapio, Irfan, and Arnaud, our fearless SAR ML experts, step in to reduce the entry barrier and promote the uptake of SAR-based ML applications.
Through the AI4SAR initiative with the European Space Agency (ESA) Φ-lab, ICEYE was presented with a challenge to create open source utilities to reduce the barrier to entry into SAR ML. As we are keen to build AI/ML applications to handle heavy image processing and scalable analytics, we have focused our first release on creating a SAR datacube structure to handle and abstract the complex SAR data while preserving the temporal and spatial resolution.
ESA Φ-lab is looking to tap into the full potential of AI/ML for space-based electro-optical sensors. As the up-and-coming commercial remote sensing technology, rapid-revisit SAR satellites in Low Earth Orbit (LEO) are promising with their observational persistence, low cost, and the competitive landscape that is driving technological advancements.
The AI4SAR initiative is a great opportunity for our team to identify the peculiarities of SAR data and present fellow data scientists with a fast track for iteration and implementation of SAR-driven analytics.
We are proud to share with you ICEcube (ICEYE datacube), our first foray into open source data abstraction and tooling for SAR data handling and datacube creation. ICEcube’s primary purpose is to facilitate ML exploration with a time-series stack of coregistered ICEYE images.
.png?width=250&name=image%20(3).png)
Figure 1. ICEYE's datacube icon highlighting the sponsorship of ESA Φ-lab as part of the AI4SAR initiative.
We have not fooled ourselves into thinking this will be the most amazing tool ever. It may even turn out that this library is not useful. I certainly hope otherwise. However, success in anything arguably occurs only after significant iterations. And what better way to iterate than to release something publicly, to open source it.
A datacube is simply a matrix array of data in three or more dimensions. For us, that is range, azimuth, and time. Once you include amplitude and complex phase information, you are well beyond ‘cube’ into ‘tesseract’ territory, but we will continue to refer to it as a simple cube for the sake of our limited human mind.
In Figure 2, the satellite is moving in the azimuth direction. Amplitude and phase information are captured at the same point on Earth at different times. The resultant acquisition stack is aligned (coregistered) and stored in ICEcube’s memory-optimized xarray data structures.
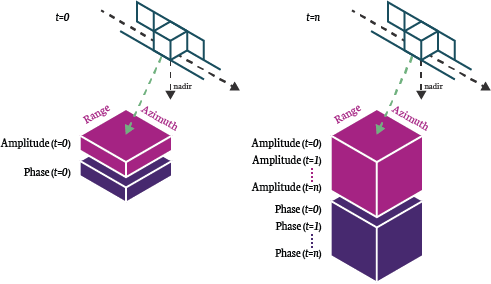
Figure 2. The ICEcube tool facilitates the stacking of ICEYE SAR in phase and amplitude as xarray datacubes. ICEYE acquires images at t = 0 for a place on Earth. Subsequent revisits of that point might result in further acquisitions (e.g. t = 1, t = 2, … t = n). The revisited location produces a stack of images that can be aligned (coregistered). The xarray matrix handling is highly memory optimized and facilitates the growth and manipulation of increasingly larger stacks.
To use ICEcube, all that is required is a stack of ICEYE standard data format (either ‘ground range detected’ or ‘single look complex’) and a config.json file with information about the date range, min and max incidence angles, and temporal resolution.
From an ML perspective, the temporal resolution is incredibly valuable for change analysis and quantifying ‘normal’ patterns of life on Earth at specific locations. Preserving this information becomes one of the most critical contributions from the SAR image stack.
We recognize that to make the most of this time-series cube structure, each subsequent image must be well-aligned (coregistered) with one-another. Despite georegistration of the imagery, often subtle spatial shifts from image-to-image manifest. The act of coregistering these images is a challenge in itself, so we will be releasing soon a simple coregistration SNAP graph for you to help you get started (more on that in a later blog).
If you are a researcher or an application developer, you can submit a proposal to ESA to gain ESA-sponsored (free) ICEYE images for research and pre-operational application development.
The intended users of ICEcube are fellow data scientists, and the documentation is designed with that in mind. In another blog, we will focus on the details and usage of ICEcube.
Now, if you are eager to play with the library, you can head over to our GitHub repo and build your own ICEcube. I promise we are almost done here. But if you can endure for a moment more, we want to highlight another aspect of the project.
Tapio, Irfan, and Arnaud are brilliant with SAR-based ML applications, but they still require further SAR backbone to push the bounds of this project and its applications. Andrea Radius is that backbone.
Providing data handling tools alone is only one component of the ESA task. The second component is to identify core use cases to test this functionality and experiment quickly with SAR ML pipelines.
With Andrea’s deep SAR expertise, he helped harness the inherent complexities of SAR data and identify some of its obnoxiously intrusive peculiarities. Andrea partnered with super engineer Bartosz Postulka from our ICEYE Poland office to identify the current state of the art in SAR ML and processing needs. From their comprehensive research, one of the most critical use cases arose out of an internal, persistent processing plight that ICEYE regularly faces.
Many SAR images exhibit either along-track (azimuth) or across-track (range) ambiguities (see Figure 2 again for the geometric visualization). The track is the satellite’s flight direction. Along-track is then a signal gathered in the same vector direction as the track itself. Cross-track is a signal observed perpendicular to the track.
In the Strip image that you see in Figure 3, the SAR image (grayscale) is georegistered and only overlaps water. However, a ‘reflection’ of land manifests on the SAR image (white box at left) and matches the true land surface (white box at right). This particular ambiguity occurs when the period between successive radar pulses is short. An echo from a distant object might return after the transmitter emits another pulse, leaving a ghost signal that can be inaccurately combined (and georegistered) with the near-field observation.
In Figure 3, the error is rather obvious, given that there is no mysterious oceanic civilization in this spot. However, automating this feature identification and removal poses a challenge as the features are variable in time, space, and signal.
Scalable, accurate ambiguity removal is important, especially if the next downstream application is to identify true features or monitor for global changes. Our team will focus on scalable removing ambiguities with ML in a future blog.
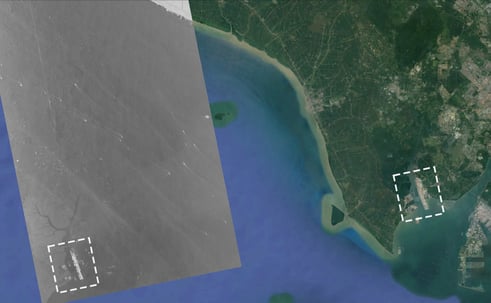
Figure 3. The ICEYE SAR image (grayscale) is geolocated and displayed over a water body. The content of the image should be entirely water signal, but a ghost ‘echo’ is observed at left (white box), which manifests from the far right landmass (white box at right). This echo, or range ambiguity, is a result of the backscattered signal returning from the far right location during the transmitted pulse used to create the SAR image at left.
Tapio has been monitoring nearly 1000 sq km of deforestation in the Amazon region since early 2021. He has modified his ML approach to take advantage of the time domain of the SAR observations. Much like we perceive disruptive change with our own eyes, anomalous fluctuations in our surroundings are often best identified using semantic context and a historic understanding of the time rate of change of a location.
His time-series, ML analysis of deforestation has resulted in a comprehensive, cloud-scaled pipeline that utilizes high-fidelity coregistration algorithms to build the relevant SAR stacks. This particular use case has helped to push the boundary of the ICEcube data handling requirements and supervised training label curation for our ESA effort.
Figure 4 shows a stack of seven Strip images from one of ICEYE’s one-day ground track repeat (GTR) orbit test sites. With repeat image intervals measured in hours instead of days, the question that the data answers is moving from 'was there deforestation?' to 'is deforestation happening right now?' Answering this question enables us to act while the site is still active instead of recording the damage done. SAR data ensures observation in all weather conditions, and machine learning enables scalable analytics.
In a future blog, Tapio will walk you through the details of his deforestation ML processing chain.
Figure 4. Stack of ICEYE Strip images showing changes in a forested area over seven consecutive days.
This image is a reminder of how much is changing around us and how quickly. It also begs us to reflect on how crucial is the contribution of high-frequency remote sensing. By decoupling the inherent complexities of SAR, we hope that ICEcube can make SAR less unnerving and facilitate greater creativity in examining the changing Earth for you, the data scientist.
SAR is the only remote sensing technology that can quantify the Earth’s changing baseline through persistent monitoring, high-spatial resolution, and frequent revisit rates.
Go build your first ICEcube and be quantitatively critical of your own world.

23 January 2026

06 November 2025

27 June 2025