Contact us
Get in touch with our experts to find out the possibilities daily truth data holds for your organization.

This is our second blog about machine learning with Synthetic Aperture Radar (SAR) data and was first published on Medium last year. Now we add it to our ICEYE blog series and offer free download of time-series SAR images for building and testing ICEcube at the end of this blog.
The first blog we published on this topic is about leveraging machine learning for SAR images and ICEYE’s focus in the AI4SAR project.
This time, we are diving deeper into the icecube toolkit that enables the creation of time-series datacubes for supervised machine learning using ICEYE SAR images.
Earth Observation (EO) data requires deep domain knowledge for data preparation and preprocessing. It cannot be readily used by non-EO experts. And SAR data adds another layer to that existing knowledge barrier.
The required data preprocessing steps include calibration, map projection, coregistration, and labels transformation from map geometry to SAR geometry. These preprocessing steps can add unnecessary pressure to ML engineers, who are used to training models on natural images, and destroy the primary purpose: training a machine learning model.
It is a known problem that the EO big data is not readily consumed by the data science and machine learning communities due to this knowledge gap, and SAR experts try to bridge it through instructions on how to preprocess the data for different applications. But the burden of learning the ropes is still on the data consumers.
Datacubes have been widely used for storing, accessing, and analyzing massive amounts of data. Think of them as information vaults that are user-friendly, platform-agnostic, and enabling easier access to the desired piece of information.
Many definitions exist based on the context and application. But for the sake of simplicity and for this blog, you can see a datacube as a multidimensional array for handling big data. Ideally, the intent of such a datacube is to efficiently handle large content of data in a memory-optimized way.
High-frequency and high-fidelity Synthetic Aperture Radar (SAR) images are an example of such massive data. Datacubes are beneficial here because they enable ease of management of SAR images, facilitating their ingestion into downstream applications using traditional algorithms or machine learning.
AI4SAR, a project sponsored by ESA Φ-lab, is an attempt to lower the entry barrier to SAR-based machine learning applications.
To shift the burden back to the data providers, EO data can be provided as analysis-ready data (ARD). ARD is user-friendly, as it simplifies the underlying knowledge that’s needed to prepare and manage the data.
With our icecube toolkit, we intend to provide a datacube for time-series SAR data, specifically designed for the data science/machine learning community. The toolkit not only aims to bridge the gap between the EO data and the ML community, but also provides an open-source infrastructure to help and grow the community.
At the same time, the icecube toolkit is not meant to be a panacea that solves all the problems for machine learning engineers when they work with the EO data. Instead, we hope that it ignites a spark for active collaboration and ongoing communication within this community so we can all better understand the needs and let the toolkit evolve accordingly.
With the icecube toolkit, we want to ensure that the community can easily:
Note: icecube refers to the toolkit, and ICEcube is the datacube you build with this toolkit.
Let’s answer the following questions to give you some insight into the toolkit:
A ML-oriented Datacube
ML models can be broadly divided into two categories: Unsupervised (no labels required) and Supervised (labels needed).
The aim of the icecube toolkit is to ensure that the generated datacubes not only preserve the SAR signal (amplitude/complex phase), but also the associated labels to train the supervised models with machine learning. This eases the burden of separately managing the annotations and SAR images.
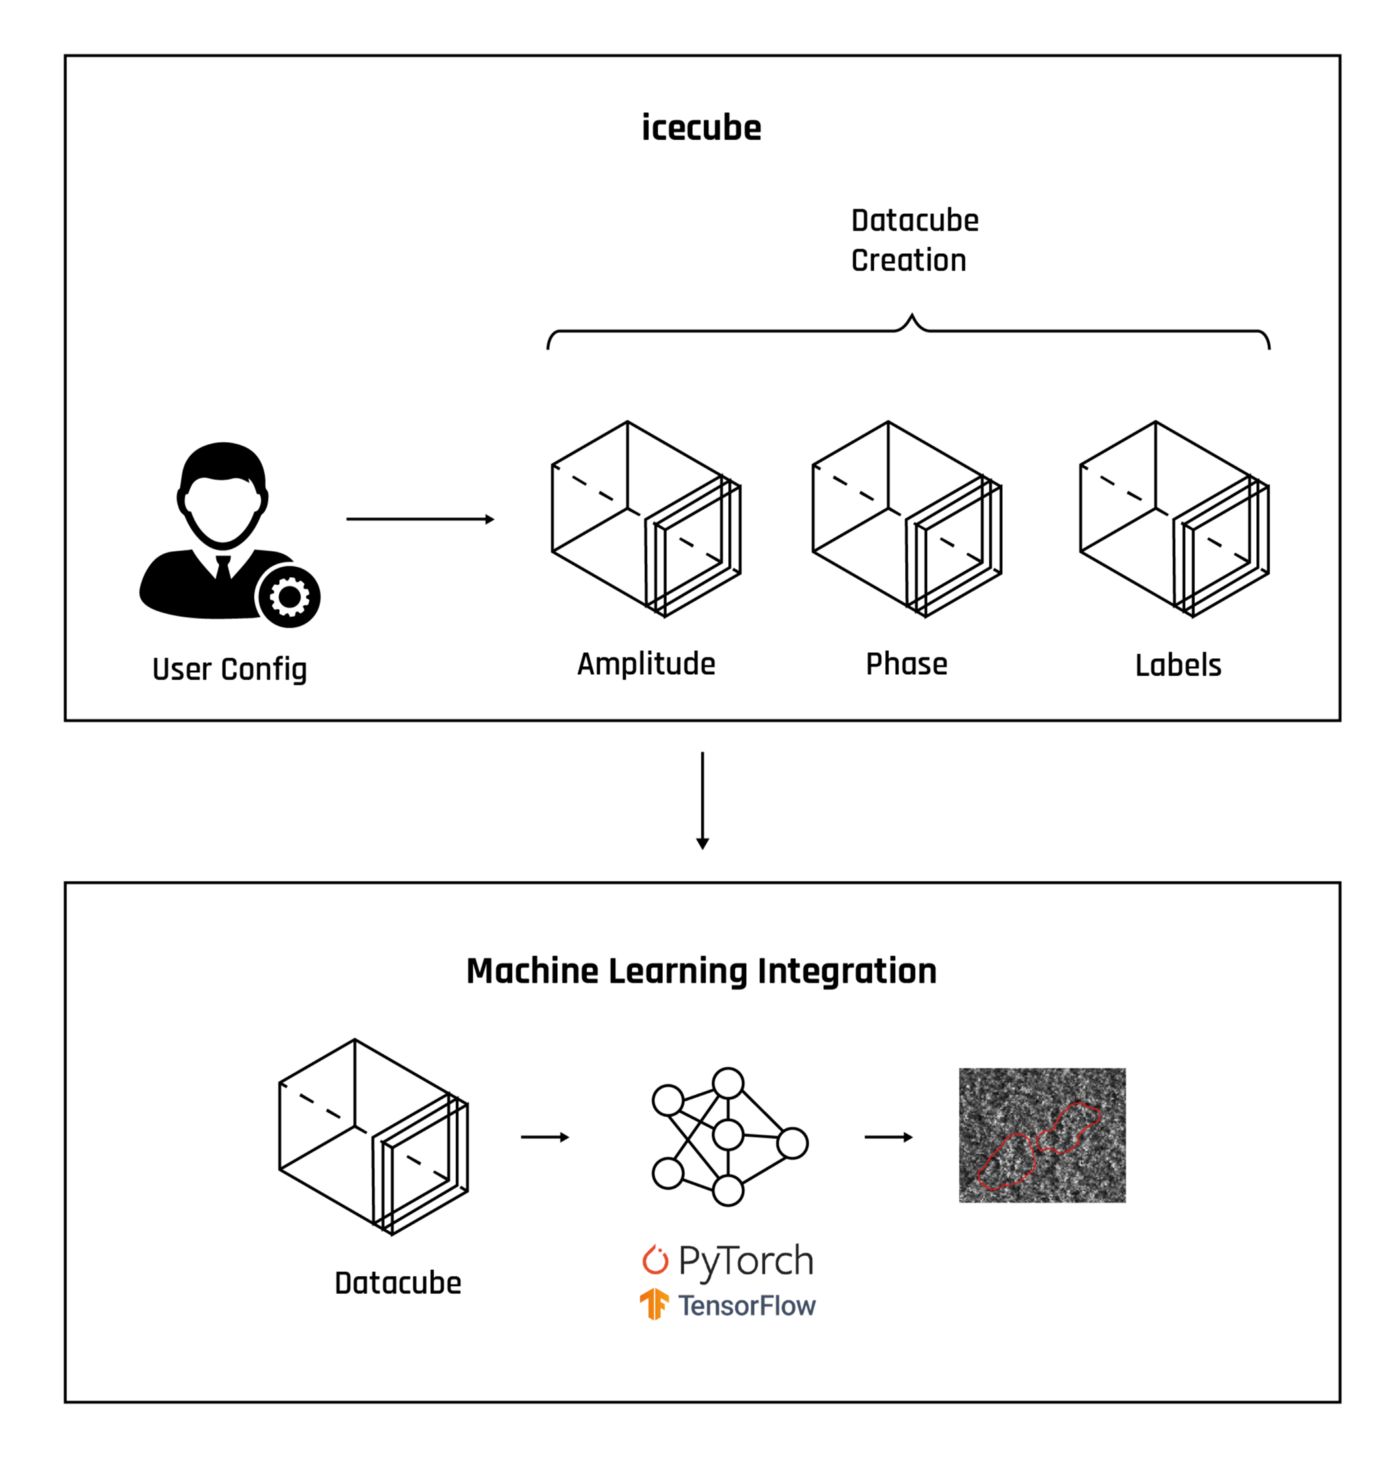
Figure 1. This graphic illustrates how the generated cubes fuse together with the ML pipeline for model training. This makes it easier for ML engineers to train ML models without worrying about the domain-specific knowledge of SAR.
A self-sufficient datacube oriented to facilitate Artificial Intelligence (AI)/ML should not only contain the SAR pixel values, but also have the capacity to ingest labels when needed. Datacubes generated with the icecube toolkit can be divided into two major sub-datacubes: SAR derived datacube and Labels datacube.
SAR-derived datacubes contain amplitude information for ground range detected (GRD) images and additionally phase information for single look complex (SLC) images. The ability to retain complex information broadens the application of datacubes to use cases like coherence analysis and SAR interferograms. The metadata is preserved at the same time in the datacube’s dictionary-like objects, thereby enabling users to perform geospatial and computational analysis.
Labels are an important component of the supervised learning algorithms. And ICEcubes have the ability to preserve annotations in vector and raster formats to enable end-to-end ML training. This makes ICEcube wholesome from the ML perspective where input data (x) and output (y) can be easily accessed within the same data object.
Raster labels contain pixel labels (mostly binary) for training the neural networks. It is most widely used in segmentation tasks, such as water or ship segmentation. The vector labels contain labels mostly in the well-known text (WKT) geometries and support polygons, bounding boxes, point, and multipoint. But in practice, these labels don’t necessarily have to be in the WKT geometries and can be arbitrary vector labels.
The Labels datacube notebook in the icecube documentation shows how to build a Labels datacube with the toolkit.
Per the state-of-the-art implementation of datacubes, the most widely used data structure is xarray. It is an open-source project and provides out-of-the-box support for creating massive multidimensional arrays.
It enables you to easily manage different data types, build massive multidimensional data, perform parallel computing, and manage data in grids. Xarray integrates well with numpy, which makes it a great choice for ML pipelines because most frameworks work with numpy arrays to create tensors for model training.
Datacubes are usually massive and can contain up to several terabytes of data that cannot fit into the average computer memory. This is where Dask comes to the rescue with its parallel computational power.

Figure 2. Key elements of an ICEcube
Xarray integrates with Dask to support parallel computations and streaming computation on datasets that don’t fit into memory. This enables the icecube toolkit to generate huge datacubes of arbitrary size, thereby solving the memory bottleneck.
Xarray has a built-in support for Zarr, which helps create cloud optimized datacubes with chunking and compression capabilities.
Finally, the generated ICEcube is stored in the netCDF4 format (.nc). Think of netCDF4 as a wrapper on top of HDF5 with improved features for data compression, parallelization, chunking, and support for huge multidimensional data arrays.
Alright! Now that we know a bit more about the data structure of ICEcube, let’s explore its design and architecture.
Given a coregistered stack of ICEYE SAR images, you can use the icecube toolkit to easily generate a datacube.
The icecube toolkit facilitates the creation of datacubes for multi-temporal SAR images or commonly referred to as a SAR stack. It is important to coregister SAR images before creating a cube because it preserves the co-located understanding of the content in the map (longitude, latitude) or image (azimuth, range) coordinates over the time duration of the stack.
If you are a beginner, this is a great source to learn about coregistration.
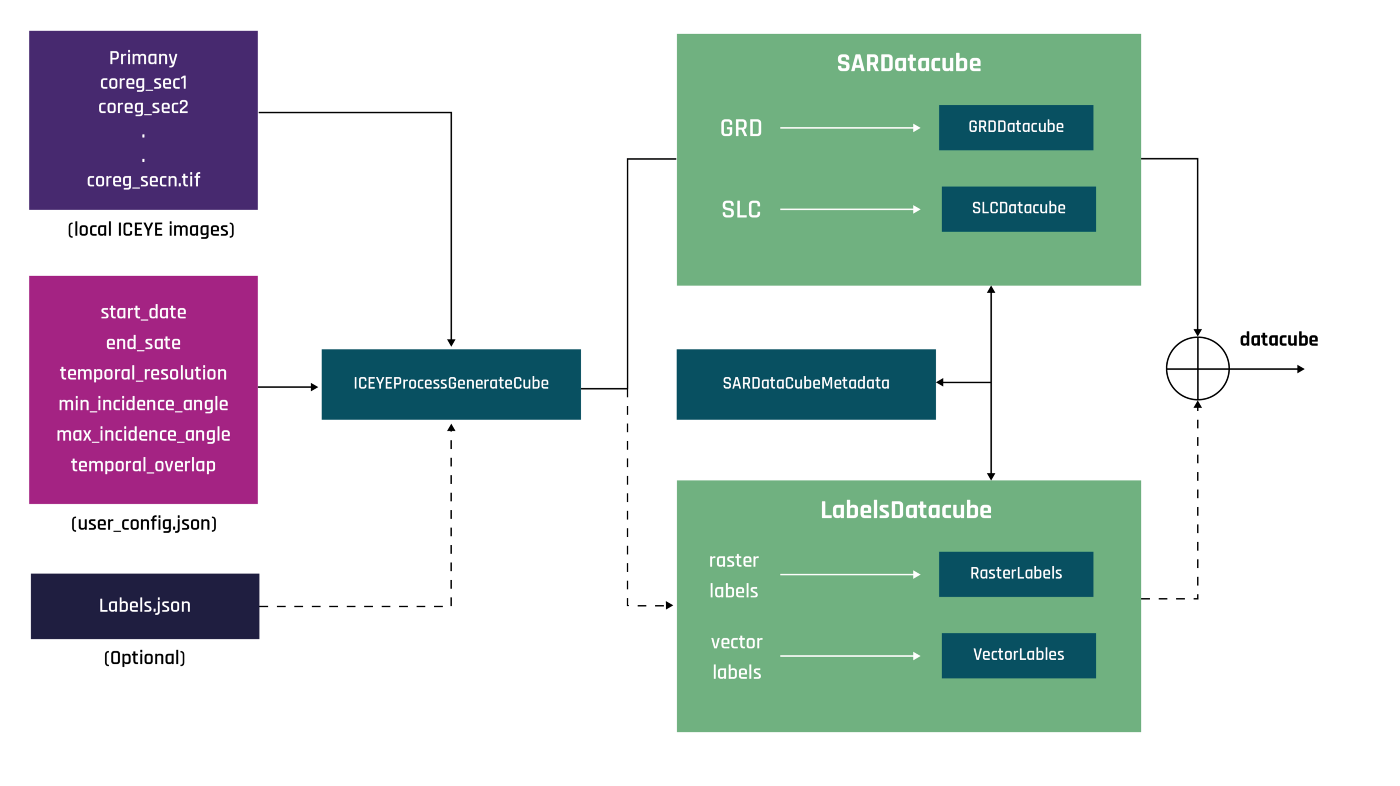
Figure 3. Architecture diagram of the icecube toolkit: an OOP-oriented architecture ensures a modular approach for the Python library. Low-level details are abstracted away from the users by the IceyeProcessGenerateCube class. This enables users to easily create cubes without worrying about the implementation details.
The primary components are briefly described as follows:
The following image illustrates the structure of a simple datacube that is generated using the icecube toolkit.
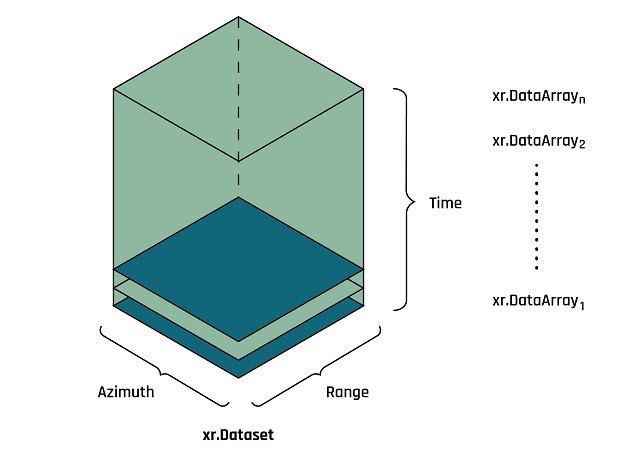
Figure 4. Illustration of a simple datacube. A datacube is basically an xarray dataset. Its values represent the concatenated xarray data arrays with dask and the coordinates are azimuth, range, and time. The metadata of the data arrays (or SAR images) are preserved in the dataset attributes.
Configuring datacubes by a JSON file provides a convenient way to build datacubes from a monolithic directory of SAR images without worrying about the manual selection of SAR data. You can dump all the SAR images into a common directory and slice the information based on your need by specifying the date range.
Similarly, for certain applications, taking an observation after some ‘d’ days can be helpful, which is where the temporal_resolution parameter of the configuration can be quite helpful.
Be it an event of interest with a short time period or of a repeated nature, you can configure your ICEcube to suit your application. Moreover, you can use a range of incidence angles to study the effect of different incidence angles for a specific application.
The following is a brief description of the parameters that you can pass to configure the datacubes:
If you use the default user configuration, all the images inside the directory are considered for building the datacubes and no pruning on dates or incidence angles is performed.
To sum it up, the power of ICEcube combined with custom configuration provide convenient ways to arrange, manage, and analyze data. This helps you focus on analytics instead of worrying about how to manage and filter your data for analysis.
My colleague, Arnaud Dupeyrat, and I presented ICEcube at ESA Φ-week 2021. We were thrilled to see so much interest in it and got many amazing questions about it!
We hope this blog has piqued your interest. Jump right into this detailed notebook to build your first ICEcube now!
Happy Cubing :)
Dataset
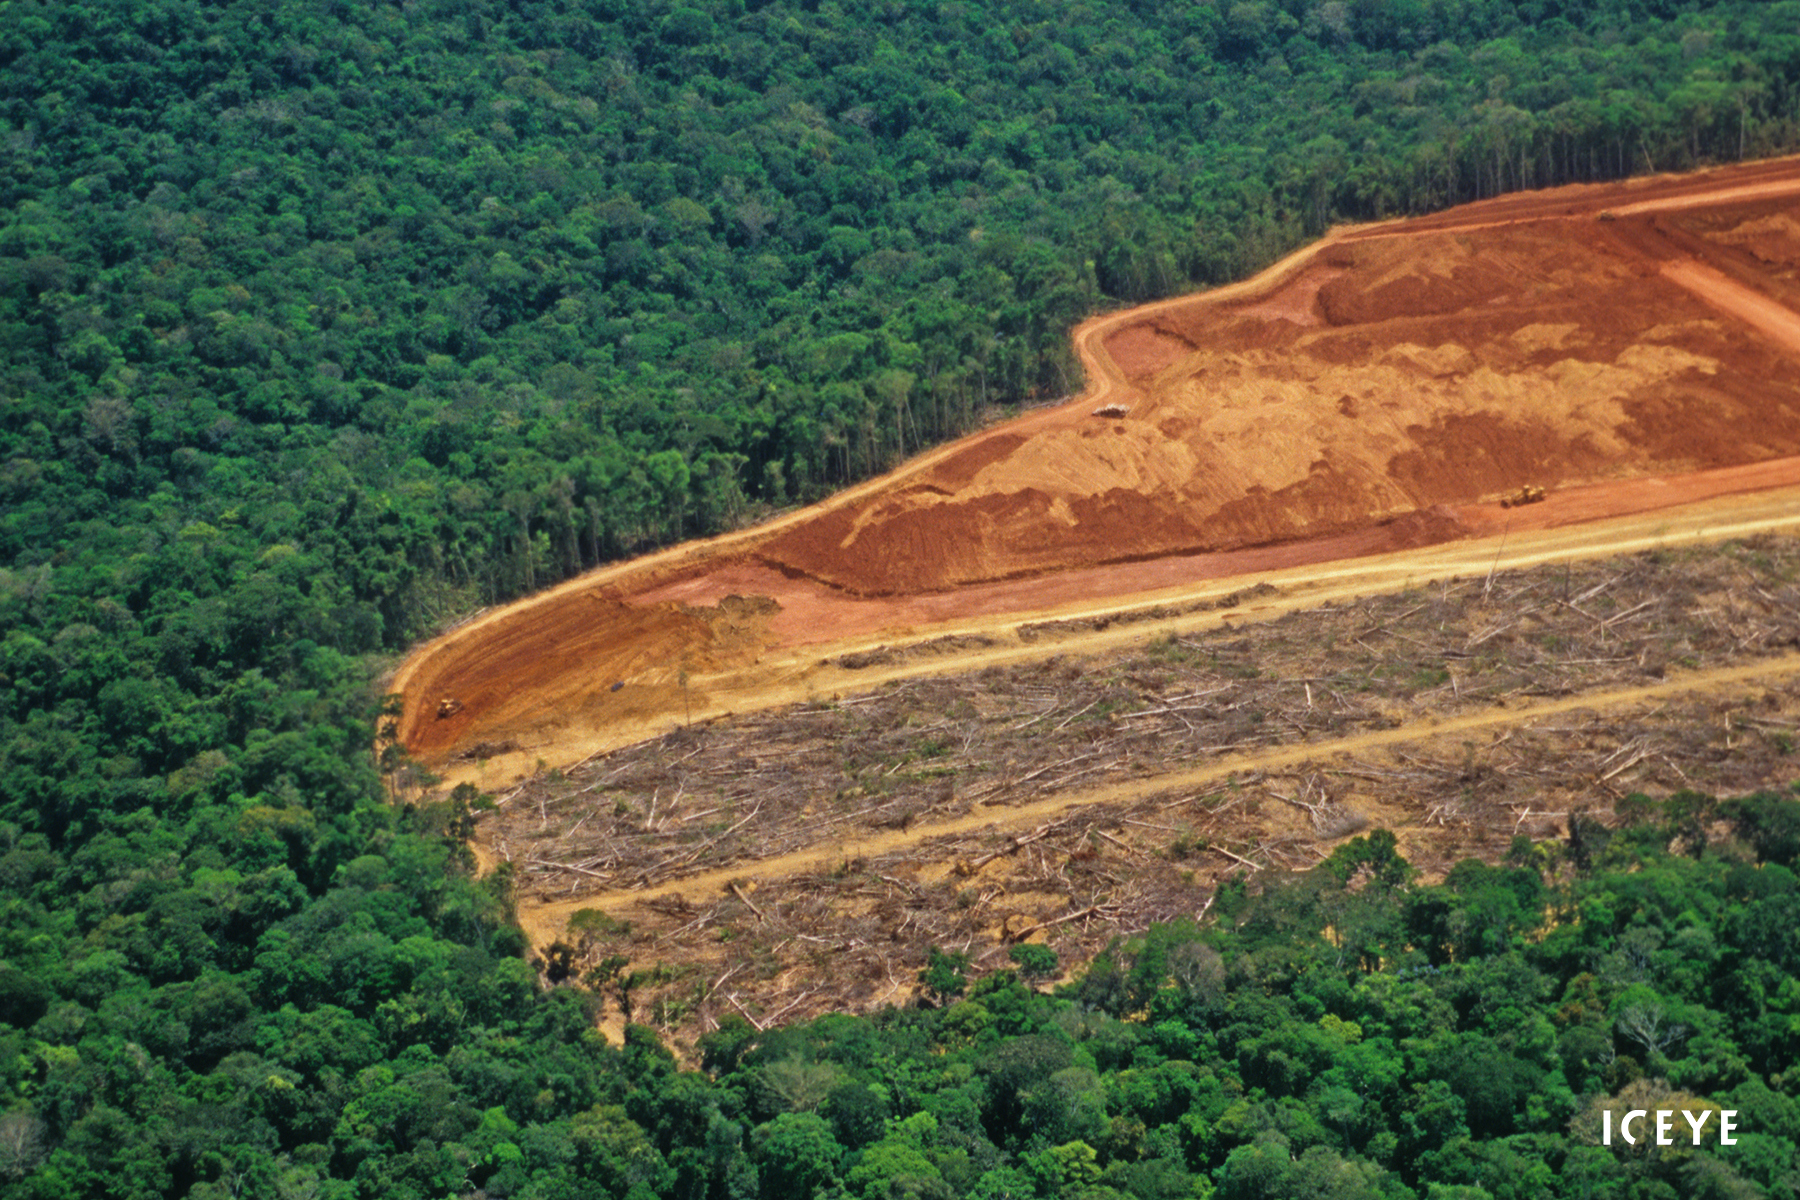
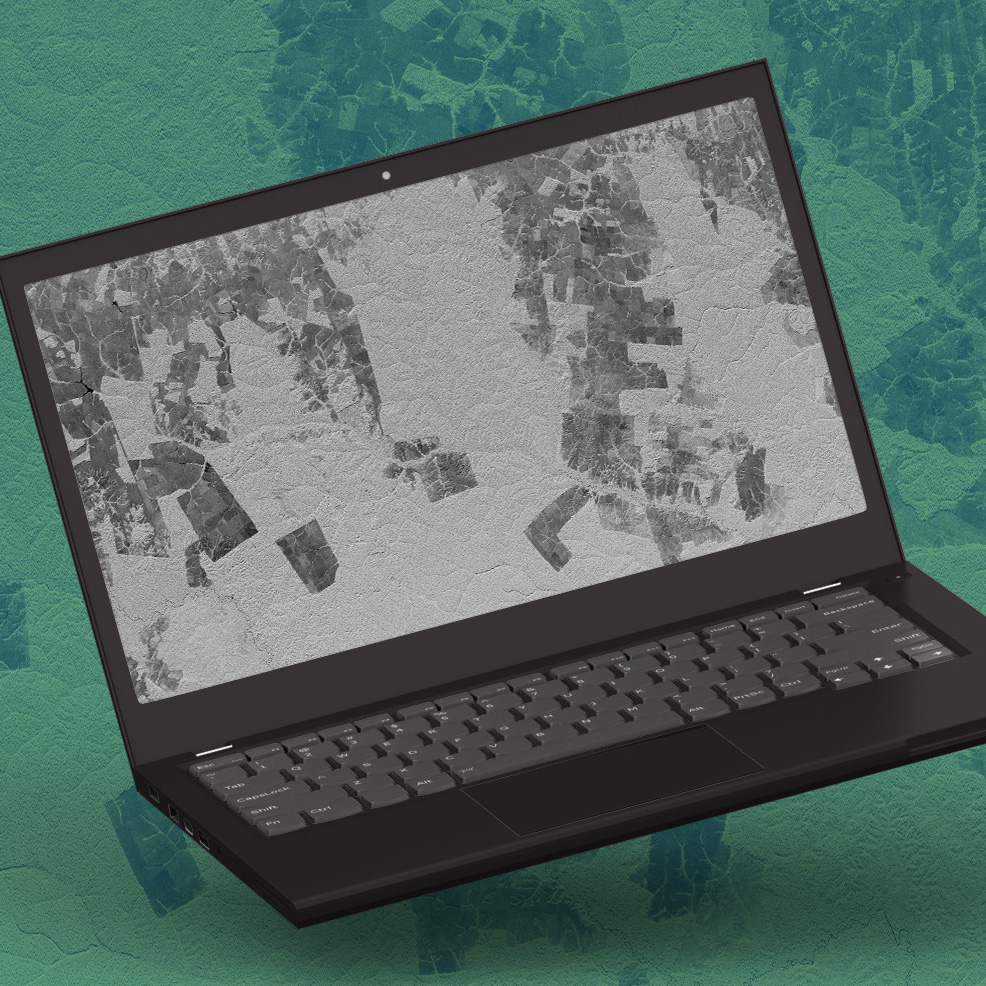
Download our data stack including four images of a forest in Acre, Brazil, taken within 12 days and explore the activities.

03 June 2026

23 January 2026

06 November 2025