Contact us
Get in touch with our experts to find out the possibilities daily truth data holds for your organization.

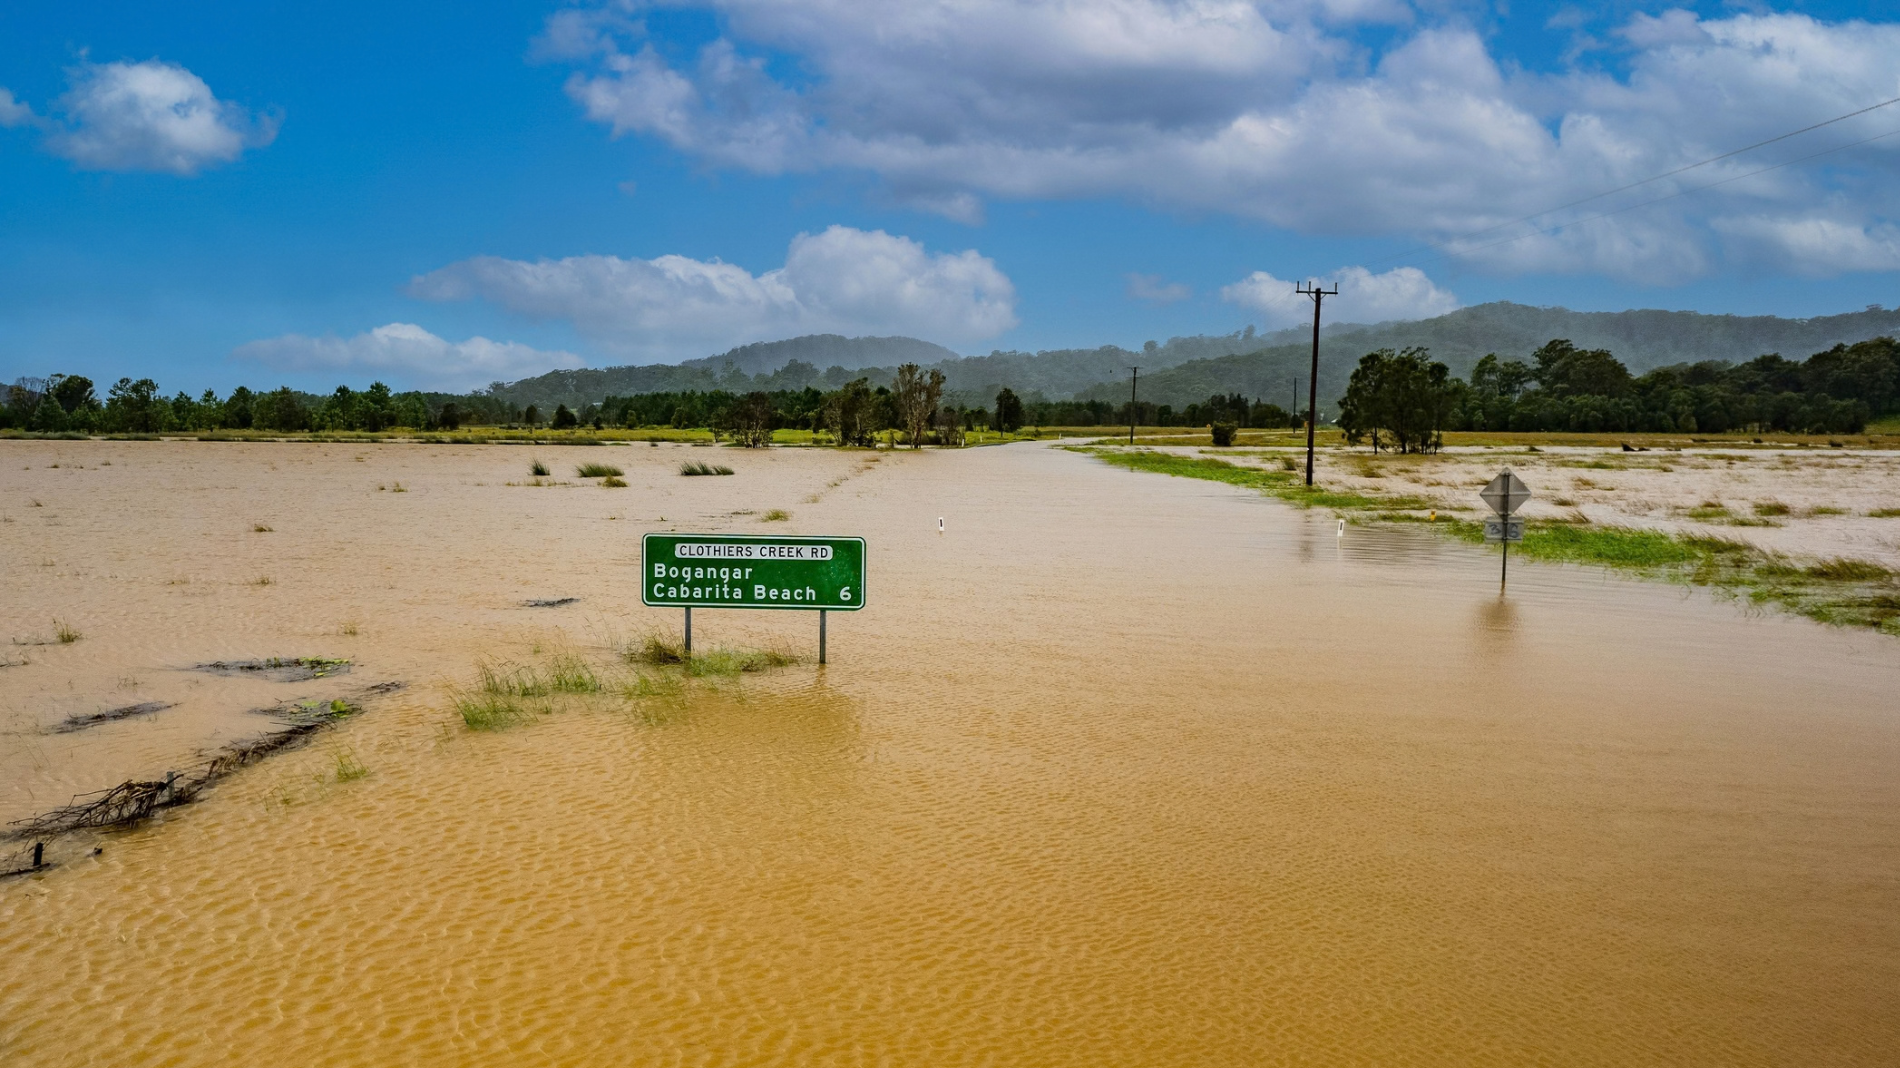
When a flood hits, emergency responders need answers, not raw or modelled data. For example, water and power corporations must understand which assets are affected, where access is cut, how customers are impacted, and what to do first – all under intense time pressure. By combining ICEYE Flood Insights with ArcGIS Online, utilities can stand up an operational flood intelligence dashboard that turns satellite data into clear, actionable intelligence for control rooms and field teams.
ICEYE and Esri Australia partnered to offer a package designed specifically to deliver the truth about floods from space, including:
By combining ICEYE’s near real-time Flood Insights with Esri’s ArcGIS platform and Esri Australia’s local expertise, emergency responders across Australia can move from “What just happened?” to “What do we do next?” in a matter of hours – not days.
This blog focuses on that dashboard experience, illustrating how it benefits government agencies, water and power utilities, and outlines a packaged offering: ICEYE Flood Insights + ArcGIS Online + Esri Australia services. Explores how an ICEYE Flood + ArcGIS Online + Esri Australia services package can help you act on flood events with unprecedented clarity. We’ll showcase a 3D Gold Coast flood demonstration powered by ICEYE’s Flood Insights, and share how you can get started through our joint offering.
Data only creates value when it turns into decisions. ICEYE’s Flood product provides high‑resolution, event‑based flood depth and extent. ArcGIS Online provides the environment to map out, assess, and share this information. The flood intelligence dashboard sits on top of both, acting as the primary lens for decision‑makers.
In a typical configuration for utilities and critical infrastructure, the dashboard brings together:
The result is a single, shared operational view where teams can immediately see:
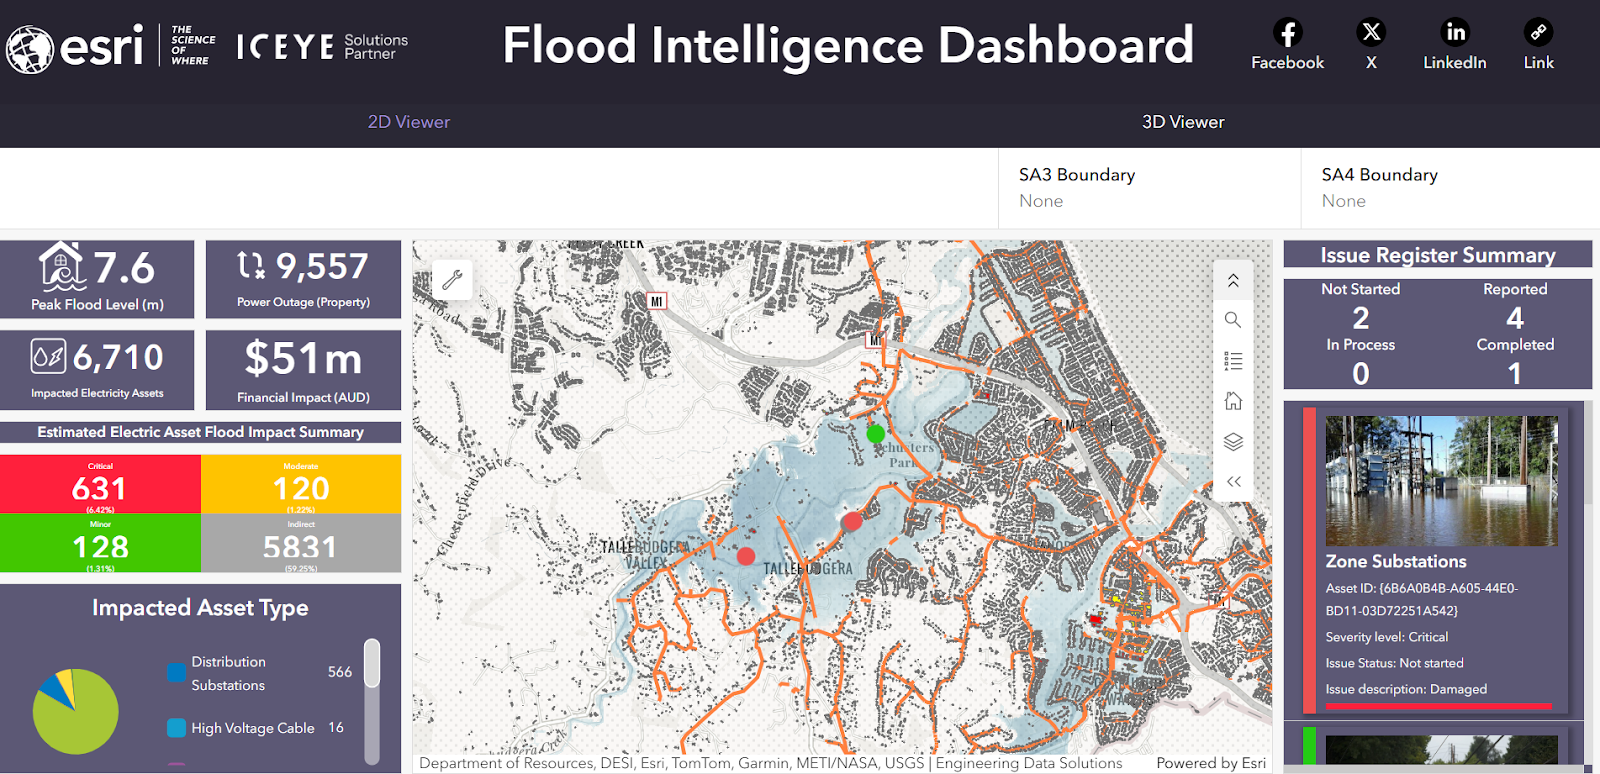
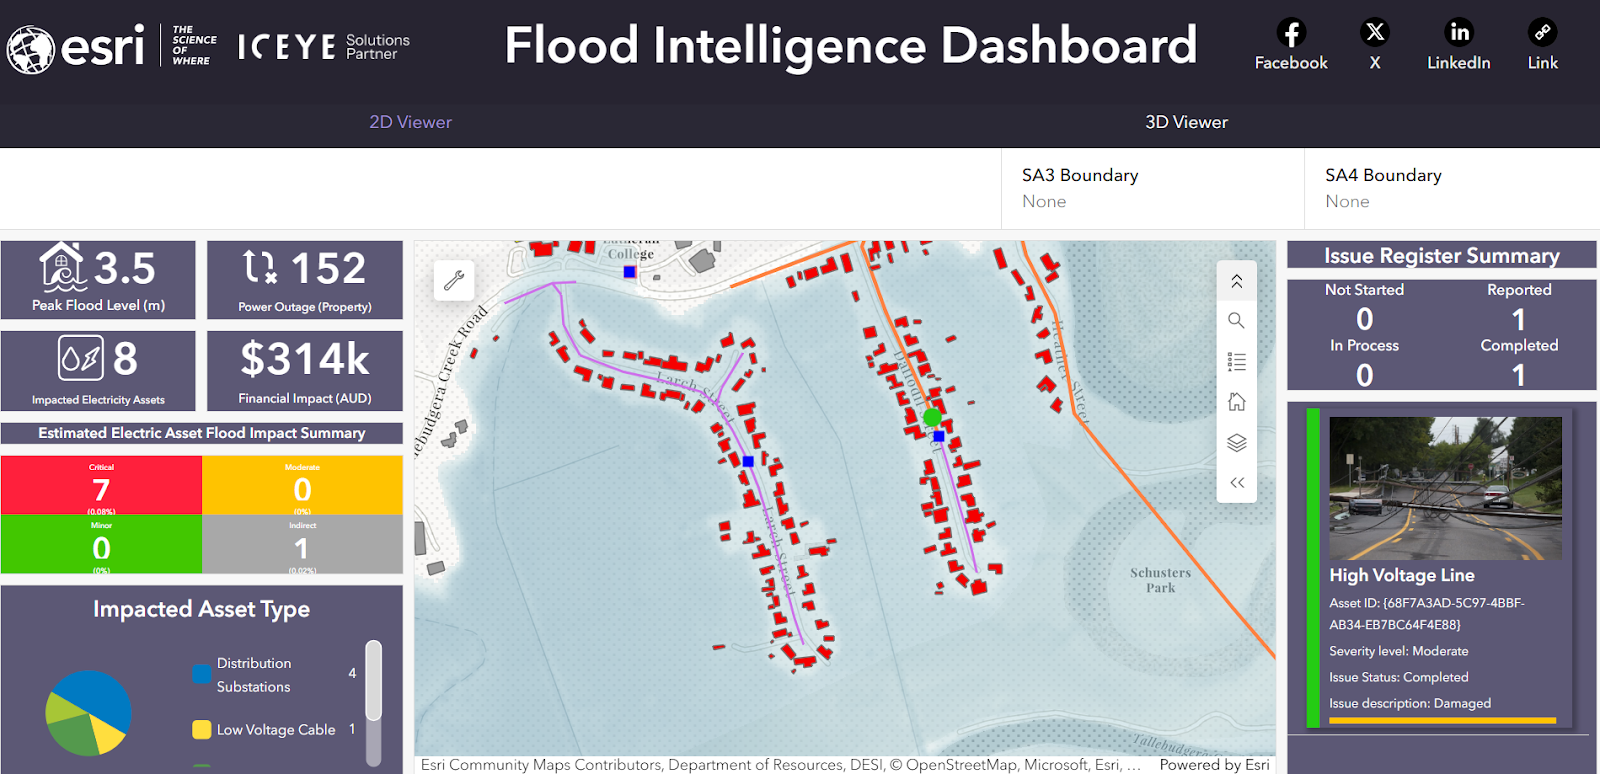
Image dashboards courtesy of Esri Australia, Alan Wong.
For complex, multi‑level environments – think dense urban substations or water treatment facilities near rivers – a 2D map can only go so far. That’s why we showcase the 3D Gold Coast flood simulation in ArcGIS Online as a reference experience. Using ICEYE Flood data and ArcGIS 3D capabilities, the dashboard can:
This 3D view is particularly powerful for:
The same visual content that appears in social “fly‑through” assets can be opened in a live, interactive ArcGIS Online dashboard during real events.
Across both water and power use cases, the dashboard is designed to be:
Operationally ready
Near real‑time aware
Configurable, not custom‑built
Designed for collaboration
The packaged offering: ICEYE Flood + ArcGIS Online + Esri Australia services
To make it easier for utilities to move quickly, ICEYE and Esri Australia are collaborating on a packaged flood intelligence offering tailored for local government, energy and utility users.
At a high level, the package brings together three elements:
1. ICEYE Flood Insights subscription
2. ArcGIS Online configuration
3. Esri Australia services
Esri Australia provides the local expertise to design, implement, and streamline the solution, including:
Together, ICEYE, Esri, and Esri Australia are working to make advanced flood intelligence from space practical and operational for end users across Australia.
If you’re looking to strengthen your flood situational awareness, visit the ICEYE partner page on the Esri Australia website and connect with the team.

25 June 2026

18 March 2026

11 December 2025