Satellite-space-cinematic_hero_medium Satellite-space-cinematic_hero_medium_mobile

Tutorials

SaVoir tutorial

Plan your SAR imaging with the Swath Acquisition Viewer (SaVoir).

Image acquisition planning for ICEYE satellites with SaVoir

The Swath Acquisition Viewer (SaVoir) is a Windows stand-alone application that ICEYE employs for quickly identifying potential acquisition opportunities over any area of interest with the ICEYE satellites and sensor, speeding up the efforts in data ordering for your needs. We provide the following basic instructions for users to plan for image acquisition with ICEYE satellites using the software SaVoir.

SaVoir setup

1. Download and install the SaVoir software

2. Log in to use SaVoir

Overview SaVoir

Setting inputs

To find acquisition opportunities over a particular region for ICEYE-X2 satellite and sensor, you need to create a scenario and you must consider:

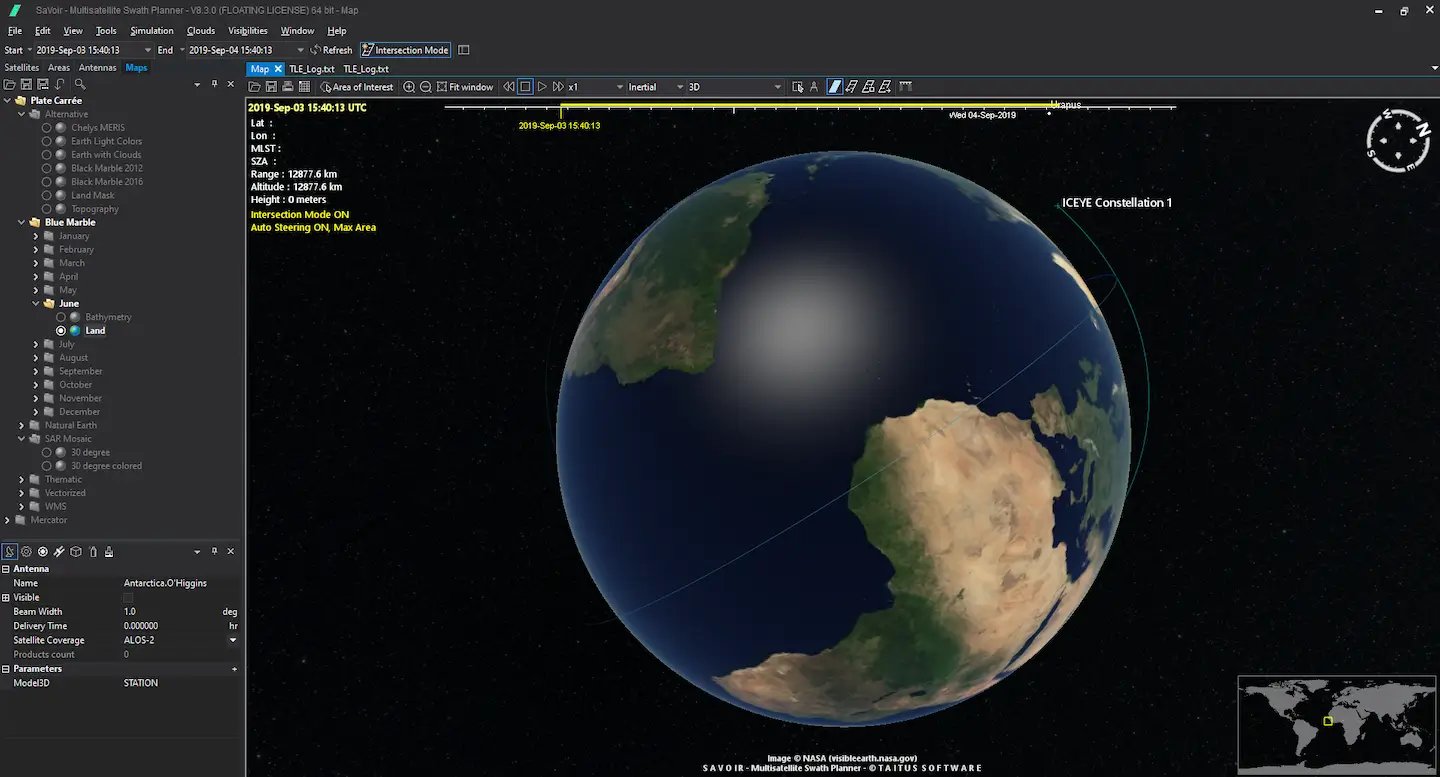
1. Setting expected time period with start and end dates (in the Time Span Selection)

Timespan selection

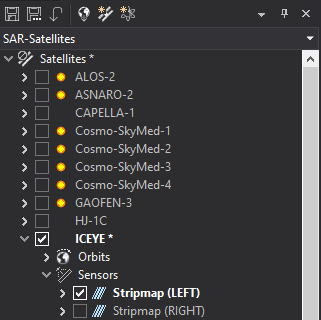
2. Satellite settings: with SaVoir latest version (8.3.0), ICEYE satellite scenarios are available in the software system.

Note: Please ensure you select ICEYE satellite from the Satellite panel and please check if their sensors are turned on

Sensor ON ICEYE Savoir

3. Locate your expected area on the 3D Map and select the Area of Interest (AOI) of your interest on the Earth view. You can set your AOI on SaVoir using the following popular ways:

  • Upload your own AOI in KML or KMZ files to SaVoir (Import... option)
  • Create a polygon on SaVoir (Polygon option)
  • Create a point on SaVoir (Point option)
Savoir AOI

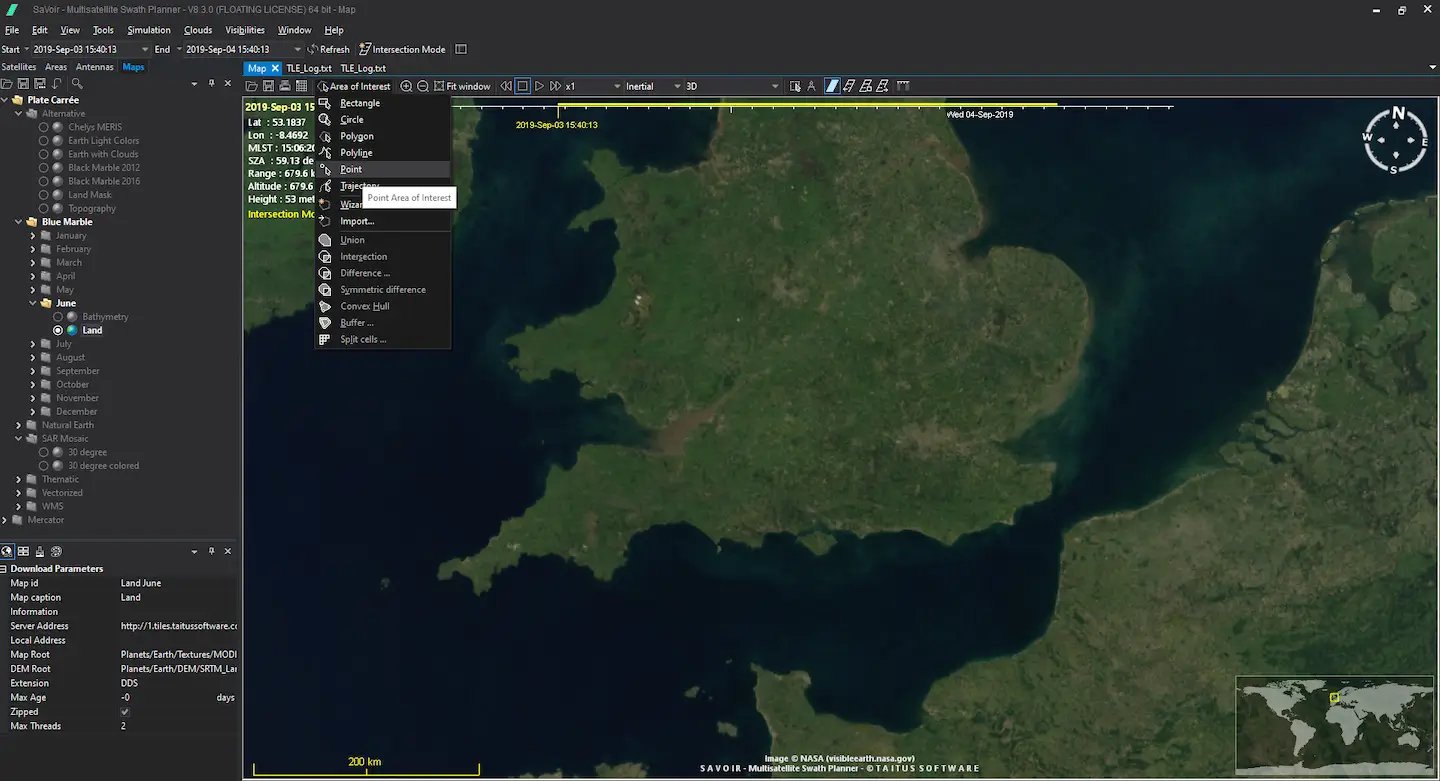
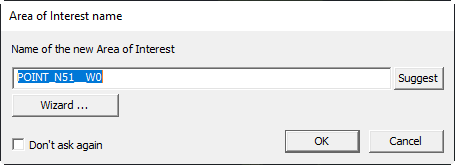
4. Name the expected AOI of your choice when asked

Name AOI ICEYE SaVoir
The basic settings have been done properly. And you can continue to run the acquisition plan by clicking Intersection mode from the tool bar and wait some time for the software to function
Intersection mode

Output review

Savoir calculates the swath intersections and represents them simultaneously on the Interactive 3D Map display and the Report View

Interactive 3D map display

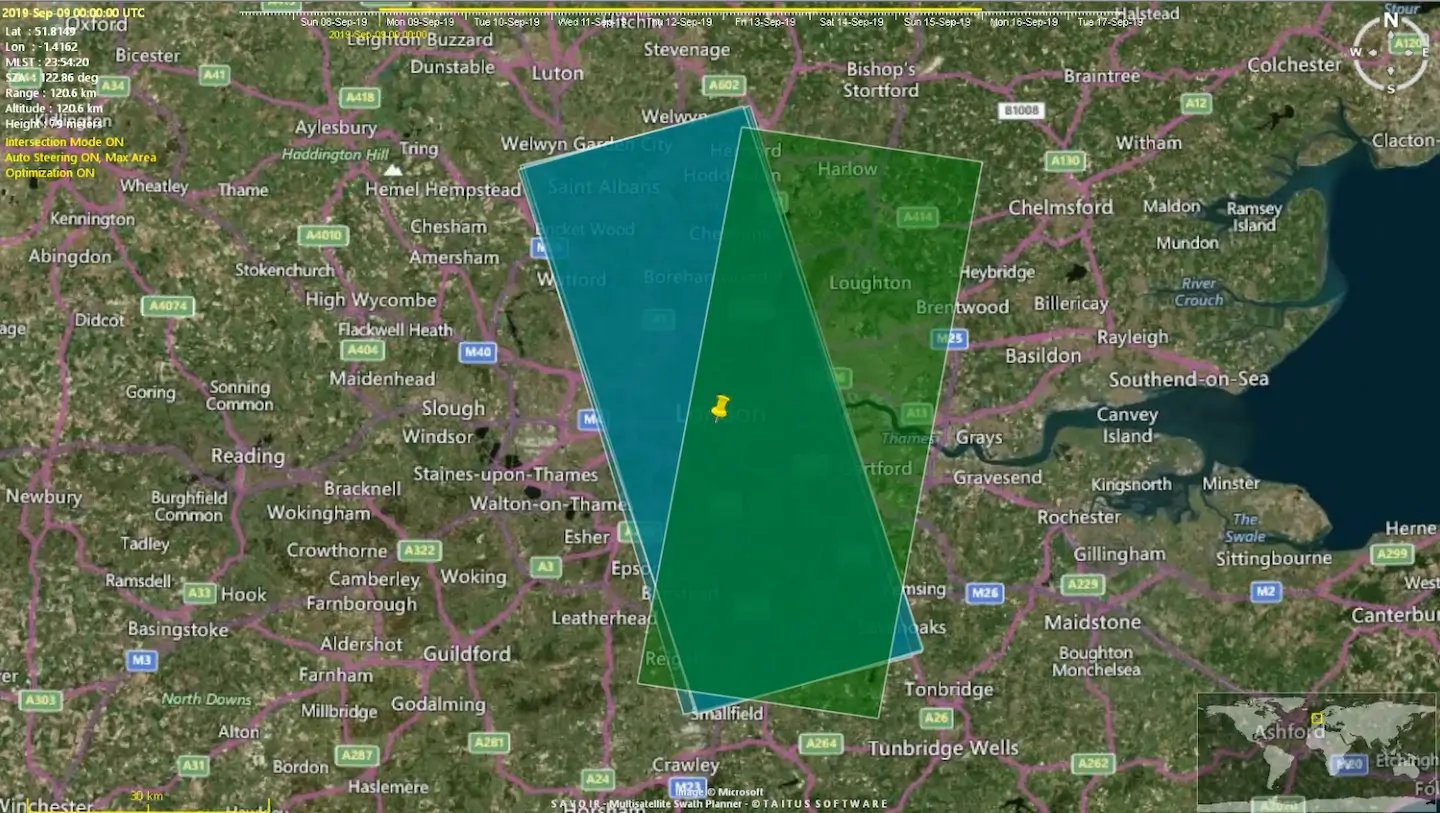
This view visualizes a scenario overlaid on a map.

3D Display view SaVoir

Report view

This view visualizes scenario data as a row and column report. Rows represent areas of interest intersections as seen on the Gantt and Map views with columns providing detailed swath information.

Download example ICEYE SAR data in SLC & GRD

Get the recent Strip dataset and discover the quality of SAR data taken with ICEYE's SAR satellite constellation.