Contact us
Get in touch with our experts to find out the possibilities daily truth data holds for your organization.
Disclaimer: The impact numbers are subject to change as ICEYE continues to analyze the flood and extend the analysis area. Some areas which have been impacted by the flooding may not be represented in this initial data.
March 20, 2023
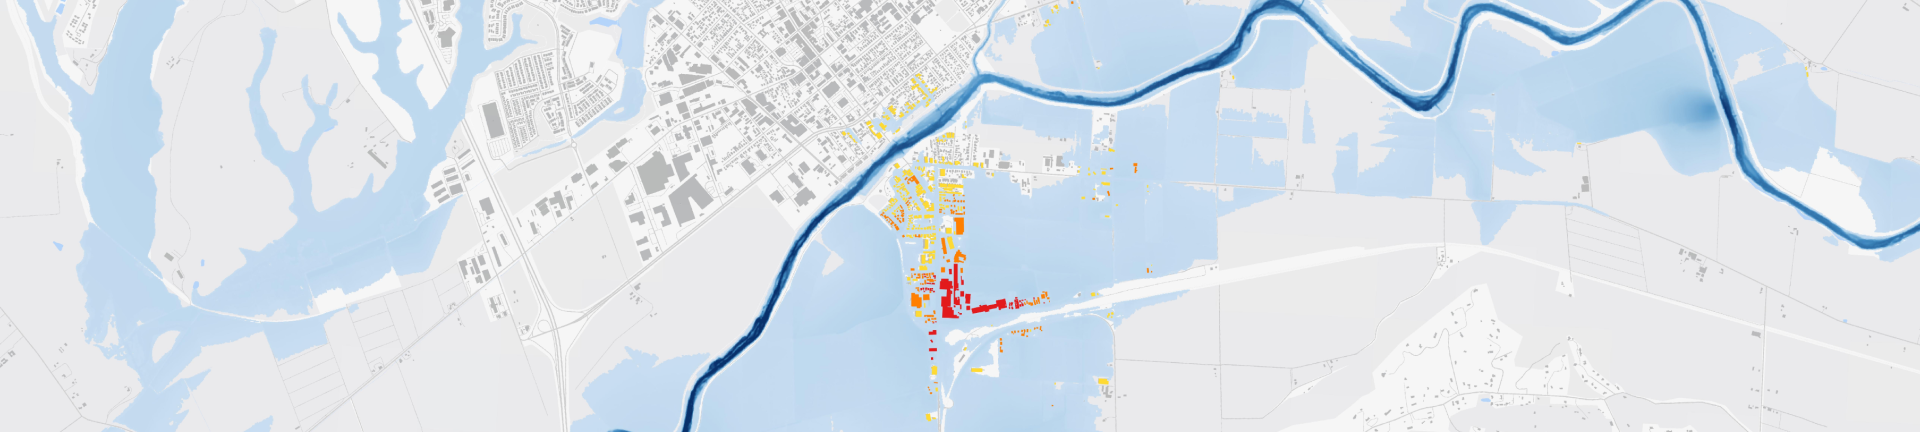
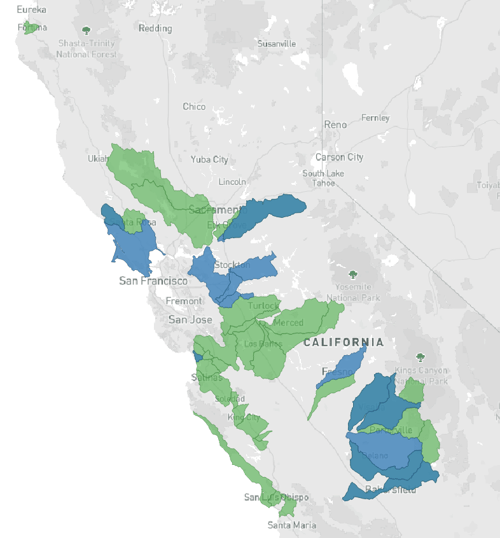
Over the weekend, we started producing the 8th release of our flood analysis as we collected more data that shows additional flooding. This latest release will be delivered to our customers within the next 24 hours. In the image below, you can see new and repeated AOIs combined. Green polygons represent AOIs that we analyzed previously, while the blue polygons illustrate areas that are repeated or newly added in release 8.
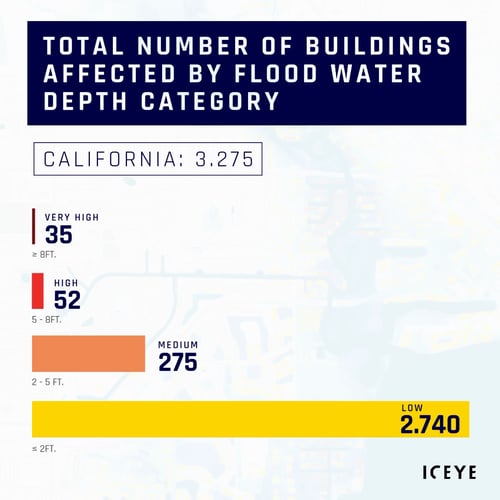
So far, the total count of impacted buildings is over 2400, based on ICEYE data. We continue to monitor the event in California and update the building count.
March 17, 2023
The 2nd part of ICEYE's Flood Briefing is now available for download. The briefing is based on our 6th flood analysis release and includes initial information on the number of buildings affected by floodwater in San Diego and San Juan Bautista.
Our team is producing the 7th release of our analysis. In the image below, you can see new and repeated AOIs combined. Green polygons represent AOIs that we analyzed previously, while the blue polygons illustrate areas where we have new data to add to our analysis.
-1.png?width=500&height=642&name=image%20(2)-1.png)
March 16, 2023
The 1st part of ICEYE's Flood Briefing is now available for download. The briefing is based on our 5th flood analysis release and includes initial information on the number of buildings affected by floodwater in Woodlake and Salinas.
Our team is producing the 6th release of our analysis. We have received new flood evidence from Los Angeles and San Diego regions and will be creating new AOIs for these areas.
In the image below, you can see new and repeated AOIs combined. Green polygons represent AOIs that we analyzed previously, while the blue polygons illustrate areas where we have new data to add to our analysis.
-1.png?width=500&height=545&name=image%20(1)-1.png)
March 15, 2023
To date, our Flood Team has mapped over 700 square kilometers (270+ sq miles) of flood in California. Based on our data, at least 1.834 buildings have been impacted by the flooding. The next release of our analysis is now being produced and will include an updated number of buildings affected.
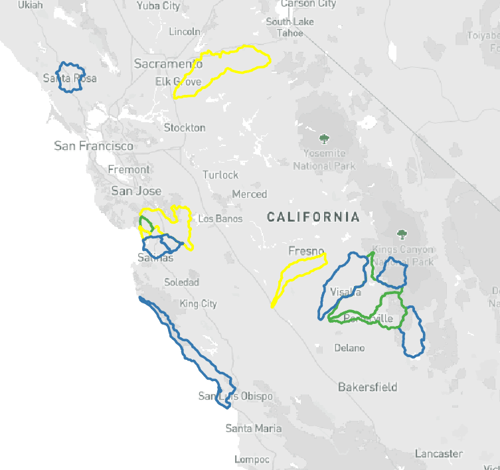
In the image above, you can see new and repeated AOIs combined. Green polygons represent AOIs that we analyzed previously, while the blue polygons illustrate areas where we have new data to add to our analysis.
March 14, 2023
Our Flood Team is closely monitoring the floods in Central and Northern California. Combining the observed flood extent and depth data from ICEYE satellites with auxiliary data sources, we are working on a new data release with several new AOIs (areas of interest) and are updating some previous AOIs from our 3rd release.
.png?width=500&height=316&name=image%20(38).png)
In the image above, you can see new and repeated AOIs combined. Green polygons represent AOIs that we analyzed previously, while the blue polygons illustrate areas where we have new data to add to our analysis.
March 14, 2023
Based on our SAR satellite data and other auxiliary data sources, we have added 6 new AOIs (areas of interest) and updated some previous AOIs.
.png?width=500&height=342&name=image%20(37).png)
March 12, 2023
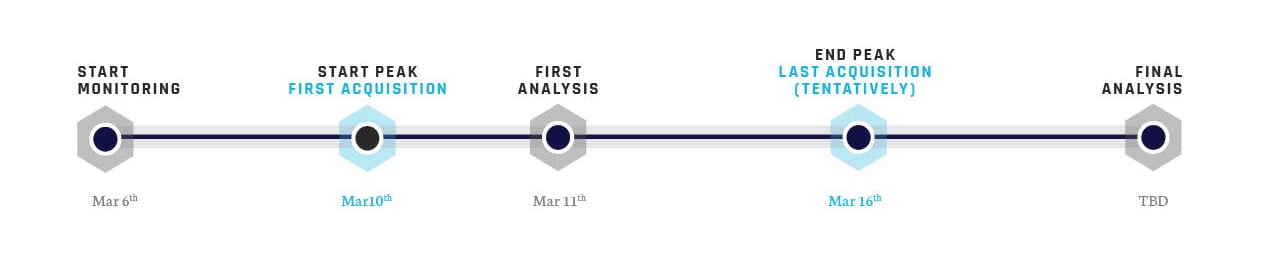
Following our initial analysis on March 11, 2023, our 2nd release was produced and will be delivered to our customers by EOD US MT on March 12.
March 11, 2023
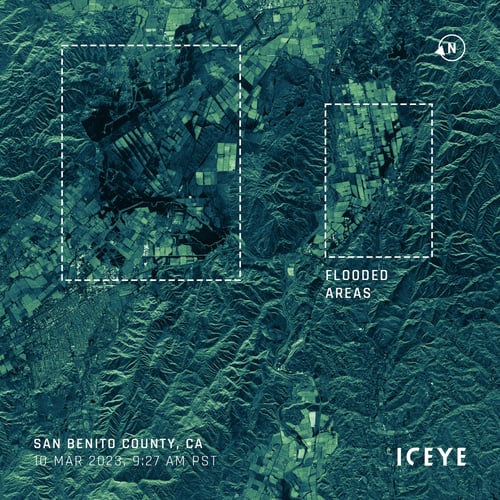
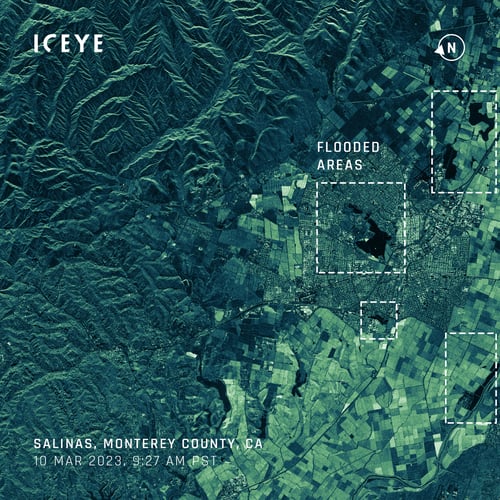
We have captured flooded areas in San Benito & Monterey Counties as of March 10, 2023. As rain persists and floods have been observed in several parts of CA, our team has initiated a detailed flood analysis.

March 2026
Download ICEYE's analysis on flooding from remnants of Typhoon Halong.

March 2026
Download ICEYE's analysis on the severe flooding and wind damage from Ex-Tropical Cyclone Alfred
