Contact us
Get in touch with our experts to find out the possibilities daily truth data holds for your organization.
Disclaimer: The impact numbers are subject to change as ICEYE continues to analyze the flood and extend the analysis area. Some areas which have been impacted by the flooding may not be represented in this initial data.
July 14, 2023
The fourth release of analysis for this event has been mapped and will be delivered to our customers with two new AOIs (areas of interest) included.
-1.png?width=500&height=633&name=image%20(8)-1.png)
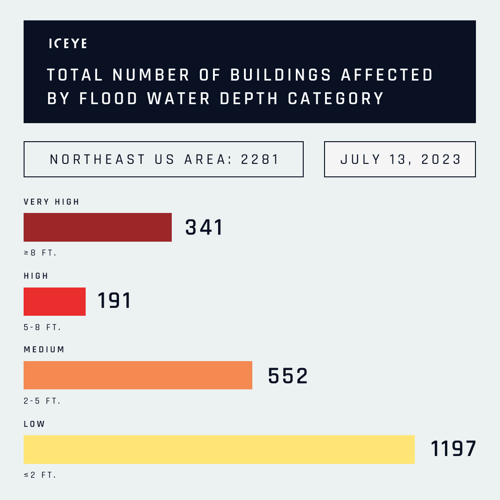
July 13, 2023
According to our most recent data, over 2000 buildings have been impacted during the floods in Northeast US. Our team has produced the second round of analysis for this event, including the number of affected buildings and inundation. The 3rd release of this event is expected to be delivered today.
July 12, 2023
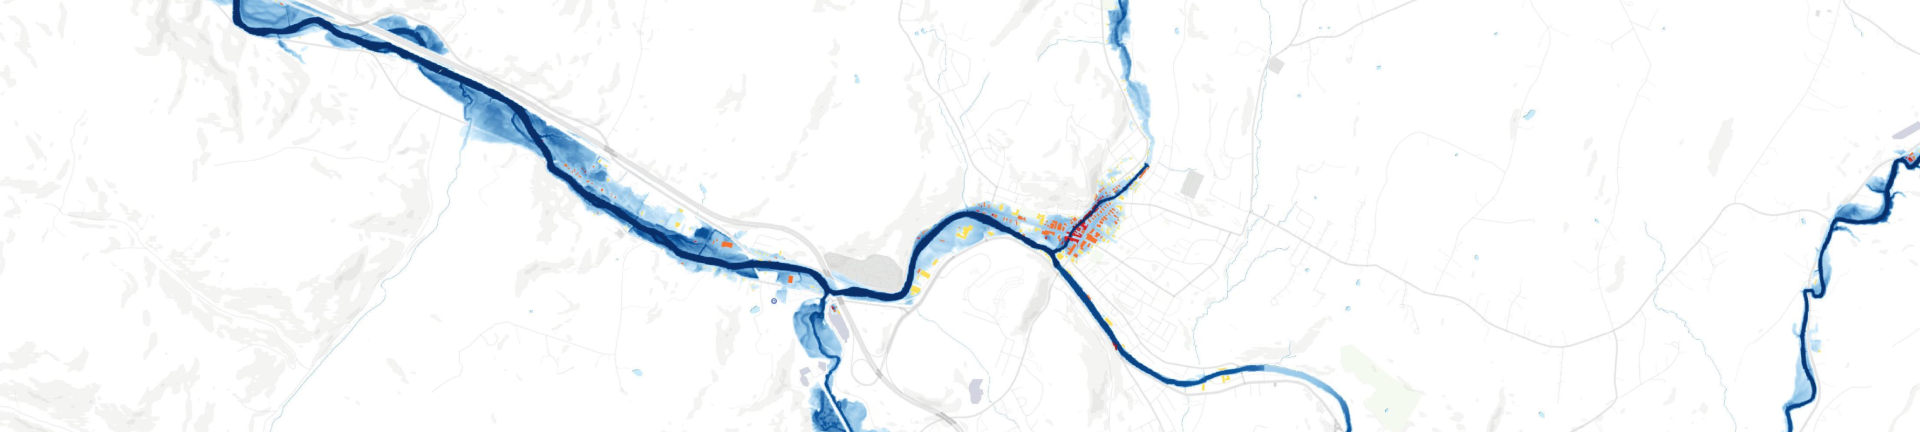
Our Flood Team is closely monitoring the floods in Northeast USA. Combining the observed flood extent and depth data from ICEYE satellites with auxiliary data sources, we are working on a new data release with several new AOIs (areas of interest) and are updating some previous AOIs from our first release.
.png?width=500&height=403&name=image%20(44).png)
In the image above, you can see new and repeated AOIs combined. Yellow polygons represent AOIs that we analyzed previously, while the red polygons illustrate new areas that we are adding to our analysis.
July 12, 2023
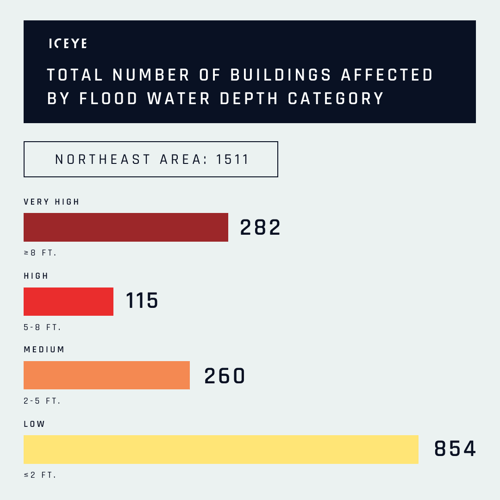
Our initial data suggests >650 affected buildings with a water depth of at least 2 feet.
Please note that our analysis of the flood situation is ongoing, and the information presented is subject to change.
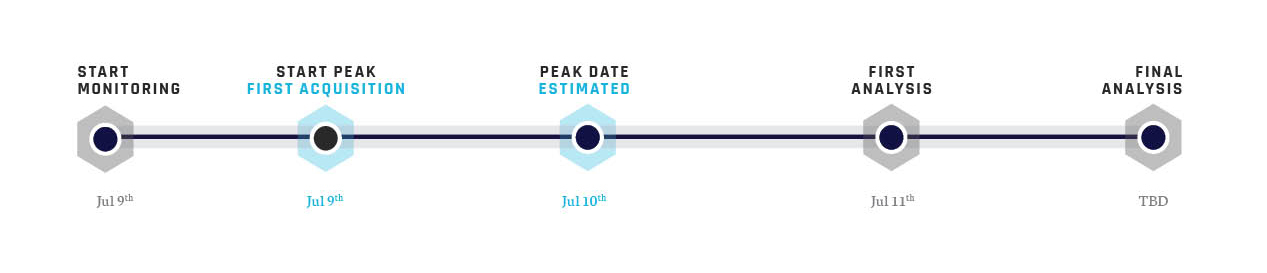
July 11, 2023
The first release of the Flood Insights product was delivered to our customers on July 11, 2023 by 23:00 UTC.
.png?width=500&height=395&name=image%20(43).png)
The above image shows the AOIs (areas of interest) covered in our first analysis release. Please note that our analysis of the flood situation is ongoing, and the information presented is subject to change.

March 2026
Download ICEYE's analysis on flooding from remnants of Typhoon Halong.

March 2026
Download ICEYE's analysis on the severe flooding and wind damage from Ex-Tropical Cyclone Alfred
